Plotly 中的标题对齐
在本文中,我们将使用plotly模块讨论标题分配和对齐。
为了使用plotly模块在可视化中对齐标题,我们将使用update_layout()方法。
句法:
plotly.graph_objects.Figure.update_layout(title_text, title_x, title_y)
Parameters:
- title: Accepts string value as the title of the visualization.
- title_x: This parameter is used to align the title in a horizontal motion and accepts a value from 0 to 1.
- title_y: This parameter is used to align the title in a vertical motion and accepts a value from 0 to 1.
让我们在以下示例中实现该方法:
示例 1
Python3
# import all required libraries
import numpy as np
import plotly
import plotly.graph_objects as go
import plotly.offline as pyo
from plotly.offline import init_notebook_mode
init_notebook_mode(connected=True)
# generating 150 random integers
# from 1 to 50
x = np.random.randint(low=1, high=50, size=150)*0.1
# generating 150 random integers
# from 1 to 50
y = np.random.randint(low=1, high=50, size=150)*0.1
# plotting scatter plot
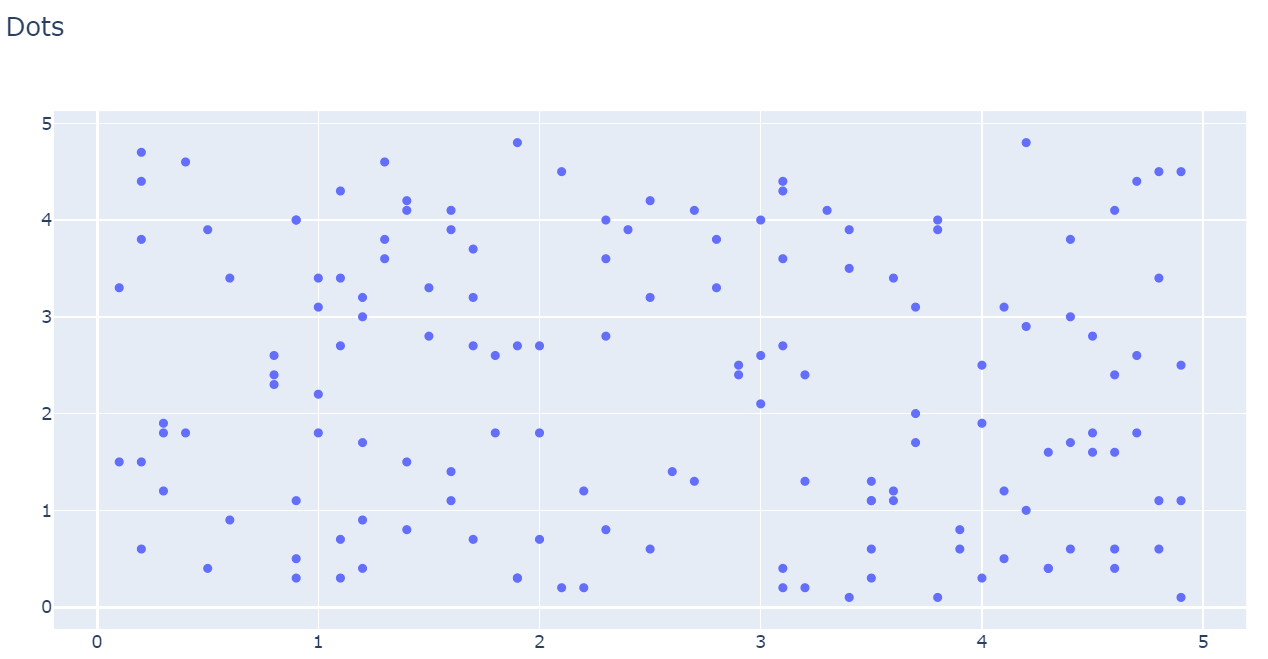
fig = go.Figure(data=go.Scatter(x=x, y=y, mode='markers'))
# title alignment
fig.update_layout(title_text='Dots')
fig.show()Python3
# import all required libraries
import numpy as np
import plotly
import plotly.graph_objects as go
import plotly.offline as pyo
from plotly.offline import init_notebook_mode
init_notebook_mode(connected = True)
# different individual parts in
# total chart
countries=['India', 'canada',
'Australia','Brazil',
'Mexico','Russia',
'Germany','Switzerland',
'Texas']
# values corresponding to each
# individual country present in
# countries
values = [4500, 2500, 1053, 500,
3200, 1500, 1253, 600, 3500]
# plotting pie chart
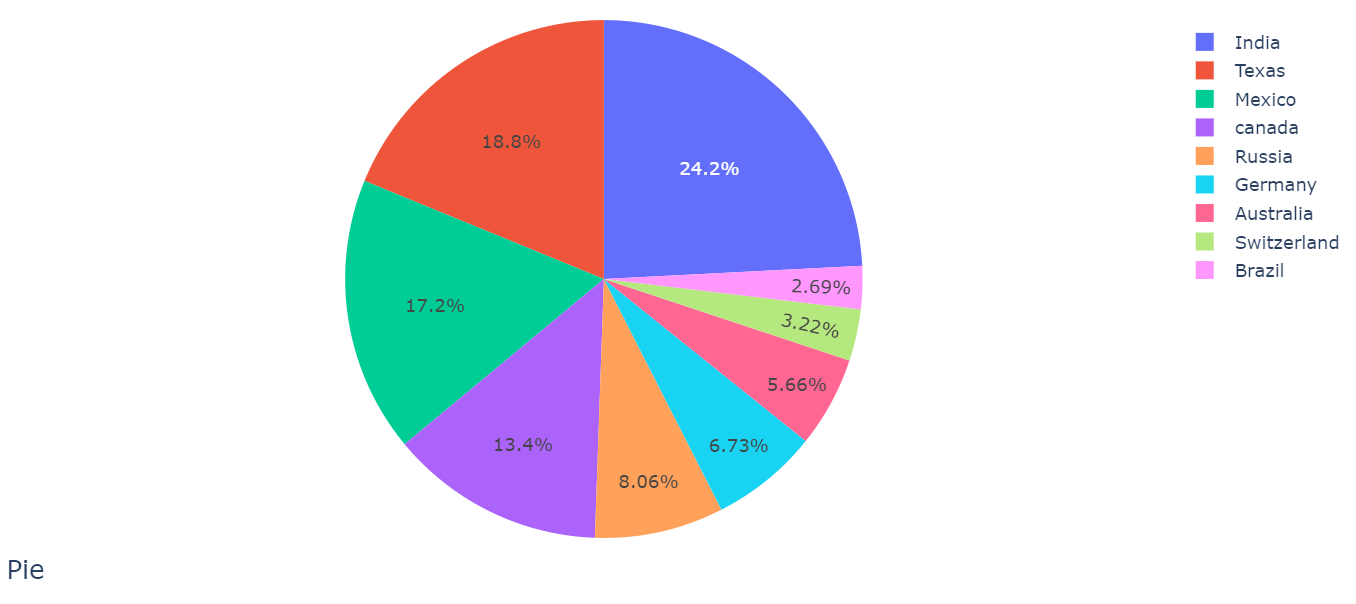
fig = go.Figure(data=[go.Pie(labels=countries,
values=values)])
# title alignment
fig.update_layout(title_text='Pie',title_y=0.5)
fig.show()Python3
# import required libraries
import dash
import dash_core_components as dcc
import dash_html_components as html
import plotly.express as px
import pandas as pd
external_stylesheets = ['https://codepen.io/chriddyp/pen/bWLwgP.css']
app = dash.Dash(__name__, external_stylesheets=external_stylesheets)
# assume you have a "long-form" data frame
df = pd.DataFrame({
"Year": ["2015", "2016", "2017", "2015", "2016", "2017"],
"Revenue": [4, 1, 2, 2, 4, 5],
"Company": ["ABC Pvt. Ltd.", "ABC Pvt. Ltd.", "ABC Pvt. Ltd.", "XYZ Pvt. Ltd.", "XYZ Pvt. Ltd.", "XYZ Pvt. Ltd."]
})
# depict visualization
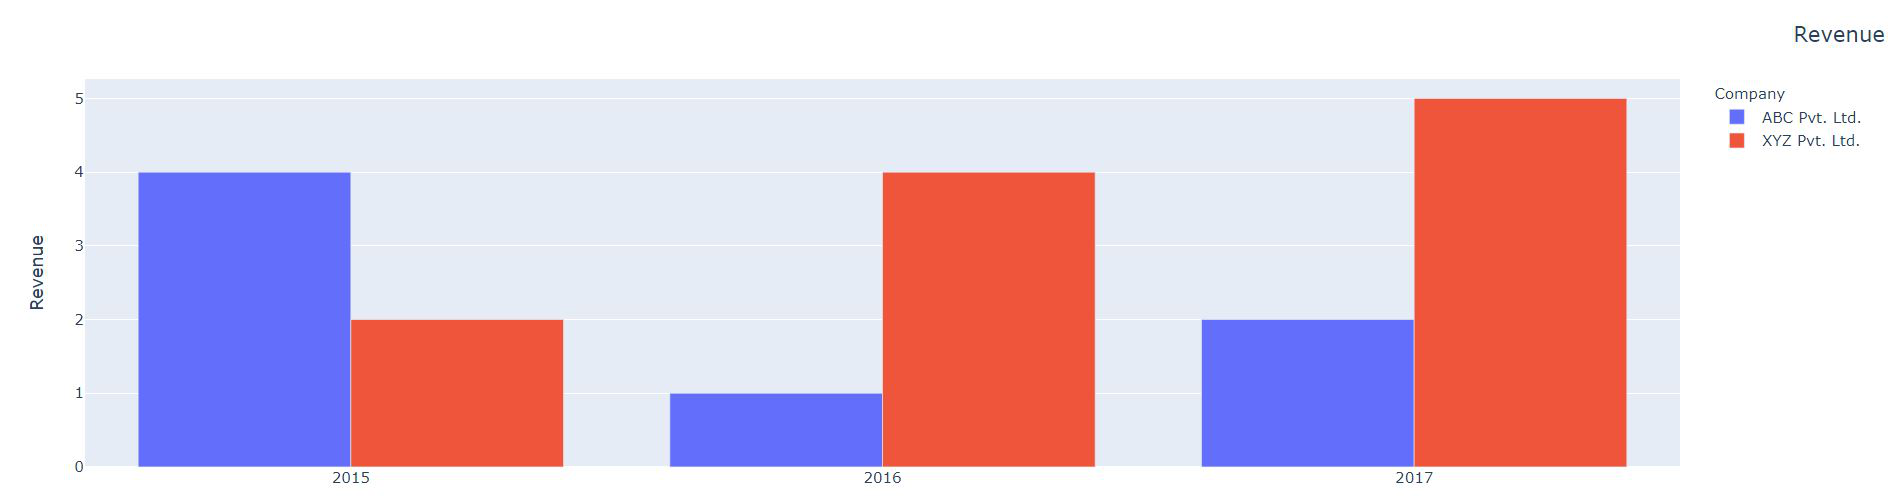
fig = px.bar(df, x="Year", y="Revenue", color="Company", barmode="group")
app.layout = html.Div(children=[
dcc.Graph(
id='example-graph',
figure=fig
)
])
# allign title
fig.update_layout(title_text='Revenue', title_x=0.5)
if __name__ == '__main__':
app.run_server(debug=True)输出:
示例 2
蟒蛇3
# import all required libraries
import numpy as np
import plotly
import plotly.graph_objects as go
import plotly.offline as pyo
from plotly.offline import init_notebook_mode
init_notebook_mode(connected = True)
# different individual parts in
# total chart
countries=['India', 'canada',
'Australia','Brazil',
'Mexico','Russia',
'Germany','Switzerland',
'Texas']
# values corresponding to each
# individual country present in
# countries
values = [4500, 2500, 1053, 500,
3200, 1500, 1253, 600, 3500]
# plotting pie chart
fig = go.Figure(data=[go.Pie(labels=countries,
values=values)])
# title alignment
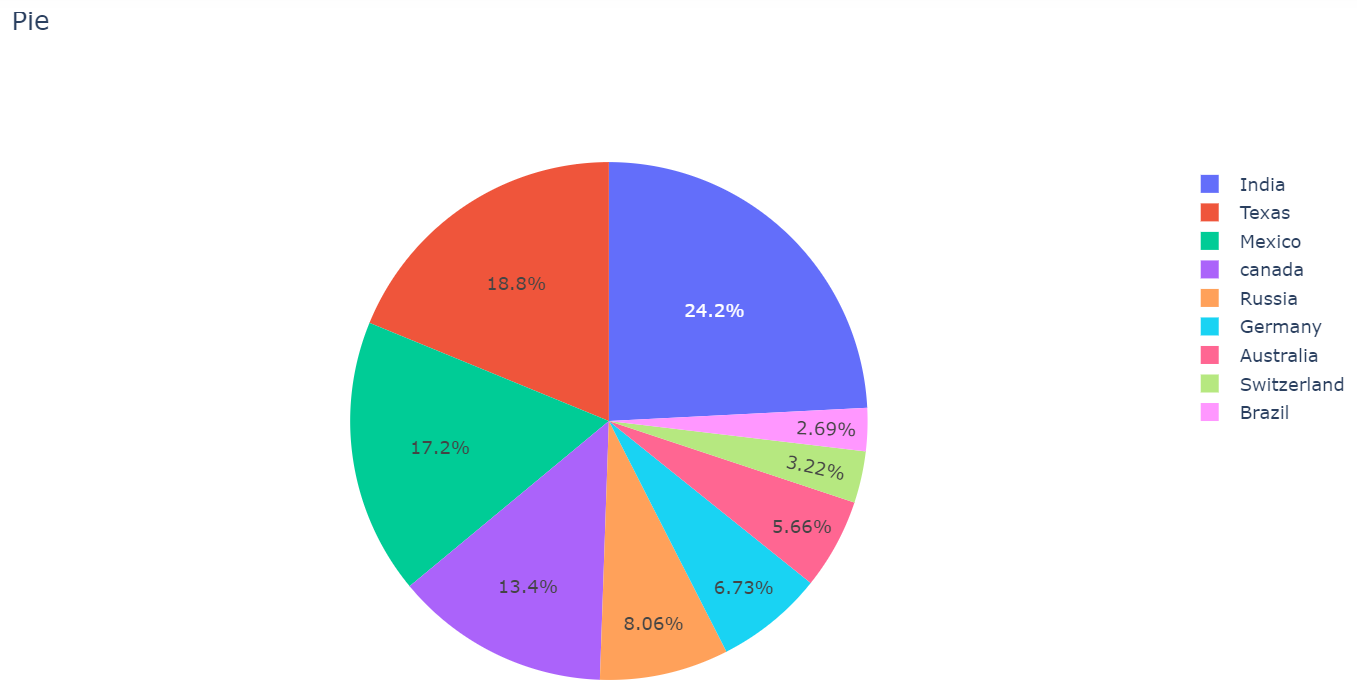
fig.update_layout(title_text='Pie',title_y=0.5)
fig.show()
输出:
使用title_y=0.5 ,标题应该在中心。

当title_y = 0.1
当title_y = 1
示例 3
蟒蛇3
# import required libraries
import dash
import dash_core_components as dcc
import dash_html_components as html
import plotly.express as px
import pandas as pd
external_stylesheets = ['https://codepen.io/chriddyp/pen/bWLwgP.css']
app = dash.Dash(__name__, external_stylesheets=external_stylesheets)
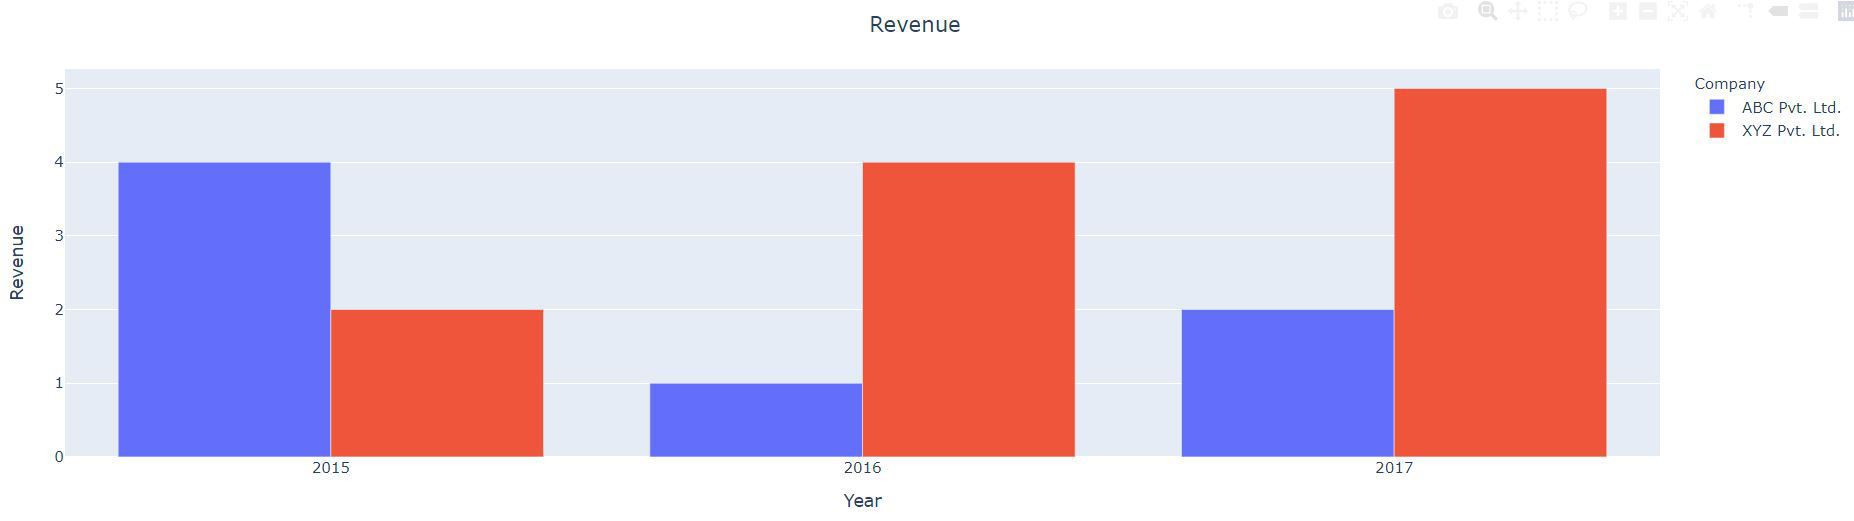
# assume you have a "long-form" data frame
df = pd.DataFrame({
"Year": ["2015", "2016", "2017", "2015", "2016", "2017"],
"Revenue": [4, 1, 2, 2, 4, 5],
"Company": ["ABC Pvt. Ltd.", "ABC Pvt. Ltd.", "ABC Pvt. Ltd.", "XYZ Pvt. Ltd.", "XYZ Pvt. Ltd.", "XYZ Pvt. Ltd."]
})
# depict visualization
fig = px.bar(df, x="Year", y="Revenue", color="Company", barmode="group")
app.layout = html.Div(children=[
dcc.Graph(
id='example-graph',
figure=fig
)
])
# allign title
fig.update_layout(title_text='Revenue', title_x=0.5)
if __name__ == '__main__':
app.run_server(debug=True)
输出:
使用title_x=0.5 ,标题应该在中心。
当title_x = 0.3

当title_x = 1