📌 相关文章
- Matplotlib-饼图
- Matplotlib-饼图(1)
- 颤动 - Javascript (1)
- 颤动如何 (1)
- 颤动 - Javascript 代码示例
- matplotlib - Python (1)
- Python -Matplotlib(1)
- matplotlib 中的图 - Python (1)
- Python -Matplotlib
- 颤动行 - 任何代码示例
- 什么是颤动 (1)
- 无颤动 - 无论代码示例
- 下拉文本字段颤动 (1)
- 颤动文本字段 (1)
- 富文本颤动 (1)
- 颤动图像
- 颤动图像(1)
- 颤动中的按钮 (1)
- 颤动按钮 (1)
- matplotlib 中的图 - Python 代码示例
- matplotlib - Python 代码示例
- 文本字段颤动示例 (1)
- 颤动颜色 (1)
- 颜色颤动 (1)
- 颤动如何 - 任何代码示例
- 路径颤动 (1)
- 在 python 中使用 matplotlib(1)
- 列颤动 - Dart (1)
- 颤动图像 - Java (1)
📜 Matplotlib-颤动图
📅 最后修改于: 2020-11-08 07:28:30 🧑 作者: Mango
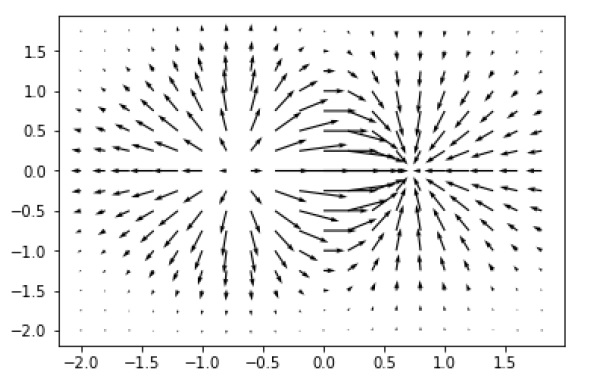
颤动图将速度矢量显示为箭头,在点(x,y)处具有分量(u,v)。
quiver(x,y,u,v)
上面的命令在x和y中每个对应的元素对中指定的坐标处将矢量绘制为箭头。
参量
下表列出了Quiver图的不同参数-
| x | 1D or 2D array, sequence. The x coordinates of the arrow locations |
| y | 1D or 2D array, sequence. The y coordinates of the arrow locations |
| u | 1D or 2D array, sequence. The x components of the arrow vectors |
| v | 1D or 2D array, sequence. The y components of the arrow vectors |
| c | 1D or 2D array, sequence. The arrow colors |
以下代码绘制了一个简单的颤动图-
import matplotlib.pyplot as plt
import numpy as np
x,y = np.meshgrid(np.arange(-2, 2, .2), np.arange(-2, 2, .25))
z = x*np.exp(-x**2 - y**2)
v, u = np.gradient(z, .2, .2)
fig, ax = plt.subplots()
q = ax.quiver(x,y,u,v)
plt.show()