如何在 R 中修复:尚未调用 plot.new
在本文中,我们将讨论如何修复 R 编程语言中的“plot.new has not been called yet”错误。
当我们尝试执行需要在 R 中存在绘图但绘图尚不存在的操作时,R 编译器会产生这样的错误。
Error in plot.xy(xy.coords(x, y), type = type, ...) :
  plot.new has not been called yet
方法 1:如何使用 lines()函数修复
在这里,我们将重点介绍如何修复 R 编译器在处理 lines()函数时可能产生的错误。
例子:
让我们考虑一个例子,我们有两个向量,分别保存 12 个不同点的相应 X 和 Y 坐标。然后我们使用 lines()函数绘制连接点的线。
R
# R program to add lines into plots

# Constructing coordinate vectors
x <- c(1.7, 2.7, 3.7, -3.7, -5.7,
       3.7, 5.7, 4.8, 10.3, -12.9, 13.8, 12.3)
y <- c(1.2, 2.3, 3.2, -3.5, -3.2, 2.1,
       4.7, .8, 1.2, 11.5, 1.3, 3.2)

# Trying to draw lines of red colors
lines(x, y, col = "red")
R
# R program to add lines into plots

# Constructing coordinate vectors
x <- c(1.7, 2.7, 3.7, -3.7, -5.7,
       3.7, 5.7, 4.8, 10.3, -12.9, 13.8, 12.3)
y <- c(1.2, 2.3, 3.2, -3.5, -3.2, 2.1,
       4.7, .8, 1.2, 11.5, 1.3, 3.2)

# Plotting the graph
plot(x, y, cex = 1, pch = 3,
     xlab ="x", ylab ="y",
     col ="black")

# Trying to draw lines of red colors
lines(x, y, col = "red")
R
# R program to add a horizontal line

# Constructing coordinate vectors
x <- c(1.7, 2.7, 3.7, -3.7, -5.7,
       3.7, 5.7, 4.8, 10.3, -12.9, 13.8, 12.3)
y <- c(1.2, 2.3, 3.2, -3.5, -3.2, 2.1,
       4.7, .8, 1.2, 11.5, 1.3, 3.2)

# Try to add horizontal line at y=5
abline(a=5, b=0, lwd=3)
R
# R program to add a horizontal line

# Constructing coordinate vectors
x <- c(1.7, 2.7, 3.7, -3.7, -5.7,
       3.7, 5.7, 4.8, 10.3, -12.9, 13.8, 12.3)
y <- c(1.2, 2.3, 3.2, -3.5, -3.2, 2.1,
       4.7, .8, 1.2, 11.5, 1.3, 3.2)

# Plotting the graph
plot(x, y, cex = 1, pch = 3,
     xlab ="x", ylab ="y",
     col ="black")

#attempt to add horizontal line at y=5
abline(a=5, b=0, lwd=3)
输出:
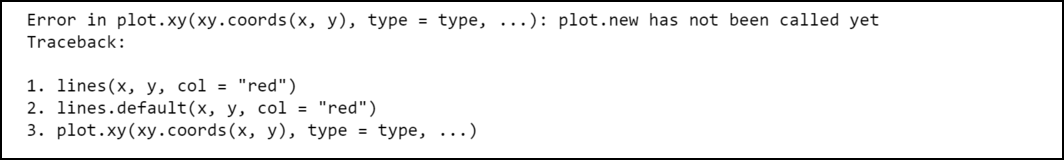
R 编译器会产生这样的错误,因为我们在使用 lines()函数之前没有创建绘图。我们可以通过在使用 lines()函数之前创建一个绘图来轻松修复此错误:
例子:
在这里,在这个例子中,我们通过简单地在 lines()函数之前调用 plot函数来修复上述错误,以获得给定点的概念。
R
# R program to add lines into plots

# Constructing coordinate vectors
x <- c(1.7, 2.7, 3.7, -3.7, -5.7,
       3.7, 5.7, 4.8, 10.3, -12.9, 13.8, 12.3)
y <- c(1.2, 2.3, 3.2, -3.5, -3.2, 2.1,
       4.7, .8, 1.2, 11.5, 1.3, 3.2)

# Plotting the graph
plot(x, y, cex = 1, pch = 3,
     xlab ="x", ylab ="y",
     col ="black")

# Trying to draw lines of red colors
lines(x, y, col = "red")
输出:
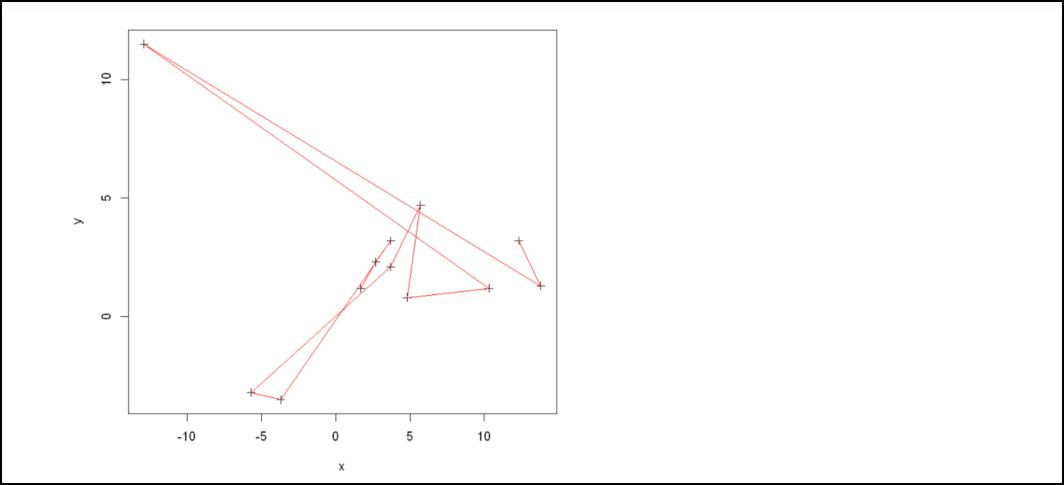
这次程序编译成功,因为我们在使用 lines()函数之前已经创建了绘图。
方法 2:如何使用 abline()函数修复:
在这一部分中,我们将重点介绍如何修复 R 编译器在处理 abline()函数时可能产生的错误。
例子:
让我们考虑一个例子,我们有两个向量,分别保存 12 个不同点的相应 X 和 Y 坐标。然后我们使用 ablines()函数在 Y = 5 处绘制一条水平线。
R
# R program to add a horizontal line

# Constructing coordinate vectors
x <- c(1.7, 2.7, 3.7, -3.7, -5.7,
       3.7, 5.7, 4.8, 10.3, -12.9, 13.8, 12.3)
y <- c(1.2, 2.3, 3.2, -3.5, -3.2, 2.1,
       4.7, .8, 1.2, 11.5, 1.3, 3.2)

# Try to add horizontal line at y=5
abline(a=5, b=0, lwd=3)
输出:

R 编译器会产生这样的错误,因为我们在使用 abline()函数之前没有创建绘图。我们可以通过在使用 abline()函数之前创建一个绘图来轻松修复此错误:
例子:
因此,为了解决上述错误,我们在 abline函数之前使用给定的参数调用 plot()函数,这样,程序编译成功,没有任何错误。
R
# R program to add a horizontal line

# Constructing coordinate vectors
x <- c(1.7, 2.7, 3.7, -3.7, -5.7,
       3.7, 5.7, 4.8, 10.3, -12.9, 13.8, 12.3)
y <- c(1.2, 2.3, 3.2, -3.5, -3.2, 2.1,
       4.7, .8, 1.2, 11.5, 1.3, 3.2)

# Plotting the graph
plot(x, y, cex = 1, pch = 3,
     xlab ="x", ylab ="y",
     col ="black")

#attempt to add horizontal line at y=5
abline(a=5, b=0, lwd=3)
输出:
