📌 相关文章
- GWT Highcharts-动态图表
- GWT Highcharts-动态图表(1)
- GWT Highcharts-3D图表
- GWT Highcharts-3D图表(1)
- GWT安装(1)
- GWT安装
- 图表中的饼图(1)
- 图表中的饼图
- GWT与React(1)
- GWT与React
- GWT测试(1)
- GWT测试
- GWT JSON
- GWT JSON(1)
- GWT-应用程序(1)
- GWT-应用程序
- GWT数据库
- GWT数据库(1)
- GWT教程(1)
- GWT教程
- python中的图表(1)
- GWT简介(1)
- GWT简介
- javascript中的图表(1)
- 图表 js 删除旧图表 - Javascript (1)
- 讨论GWT
- GWT XML
- GWT XML(1)
- GWT-概述(1)
📜 GWT图表
📅 最后修改于: 2021-01-02 12:55:33 🧑 作者: Mango
GWT图表
GWT不包含用于创建图表的预安装存储库。我们可以从maven仓库下载它的仓库。在gwt中,通过gwt图表工具(也称为Google Visualization)创建图表。
要设置GWT图表,请执行以下步骤:
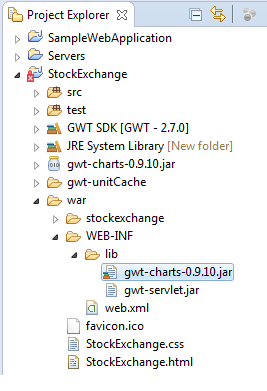
- 将gwt-charts.jar复制到现有项目或新项目中。
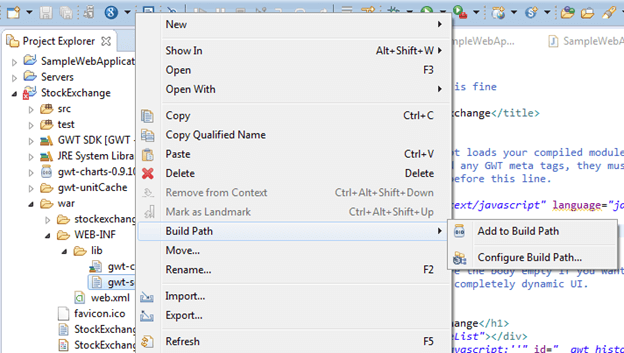
- 右键单击jar文件,然后选择构建路径选项,然后添加到构建路径选项。
- 要使用Maven存储库,我们通过添加以下代码来更改XML文件:


    com.googlecode.gwt-charts
    gwt-charts
    0.9.10
GWT图表列表:
- 注解
- 区
- 酒吧
- 泡沫
- 日历
- 烛台
- 地理图
- 直方图
- 地图
- 饼图等
GWT图表示例
在此代码中,我们实现了“面积图” ,其中根据咖啡生产订单显示了面积。
import com.google.gwt.dom.client.Style.Unit;
import com.google.gwt.user.client.ui.DockLayoutPanel;
import com.googlecode.gwt.charts.client.ChartLoader;
import com.googlecode.gwt.charts.client.ChartPackage;
import com.googlecode.gwt.charts.client.ColumnType;
import com.googlecode.gwt.charts.client.DataTable;
import com.googlecode.gwt.charts.client.corechart.AreaChart;
import com.googlecode.gwt.charts.client.corechart.AreaChartOptions;
import com.googlecode.gwt.charts.client.options.HAxis;
import com.googlecode.gwt.charts.client.options.VAxis;

public class AreaChartExample extends DockLayoutPanel {
    private AreaChart chart;

    public AreaChartExample() {
        super(Unit.PX);
        initialize();
    }

    private void initialize() {
        ChartLoader chartLoader = new ChartLoader(ChartPackage.CORECHART);
        chartLoader.loadApi(new Runnable() {

            @Override
            public void run() {
                // Create and attach the chart
                chart = new AreaChart();
                add(chart);
                draw();
            }
        });
    }

    private void draw() {
        String[] countries = new String[]
        { "Bolivia", "Ecuador", "Madagascar", "Papua Guinea", "Rwanda" };
        String[] months = new String[]
        { "2004/05", "2005/06", "2006/07", "2007/08", "2008/09" };
        int[][] values = new int[][] {
        { 165, 135, 157, 139, 136 }, { 938, 1120, 1167, 1110, 691 },
                { 522, 599, 587, 615, 629 },
                { 998, 1268, 807, 968, 1026 }, { 450, 288, 397, 215, 366 } };


        // Prepare the data
        DataTable dataTable = DataTable.create();
        dataTable.addColumn(ColumnType.STRING, "Year");
        for (int i = 0; i < countries.length; i++) {
            dataTable.addColumn(ColumnType.NUMBER, countries[i]);
        }
        dataTable.addRows(months.length);
        for (int i = 0; i < months.length; i++) {
            dataTable.setValue(i, 0, months[i]);
        }
        for (int col = 0; col < values.length; col++) {
            for (int row = 0; row < values[col].length; row++) {
                dataTable.setValue(row, col + 1, values[col][row]);
            }
        }

        // Set options
        AreaChartOptions options = AreaChartOptions.create();
        options.setTitle("Monthly Coffee Production by Country");
        options.setIsStacked(true);
        options.setHAxis(HAxis.create("Cups"));
        options.setVAxis(VAxis.create("Year"));

        // Draw the chart
        chart.draw(dataTable, options);

        }
}
输出:

GWT图表控件
GWT图表具有控制功能,使图表创建可以位于不同的控制区域中。
以下是一些控件:
- 分类过滤器
- 图表范围过滤器
- 日期范围过滤器
- 号码范围过滤器
- 字符串过滤器
GWT图表示例
以下代码是“图表范围过滤器”的代码:
import com.google.gwt.dom.client.Style.Unit;
import com.google.gwt.user.client.ui.DockLayoutPanel;
import com.googlecode.gwt.charts.client.ChartLoader;
import com.googlecode.gwt.charts.client.ChartPackage;
import com.googlecode.gwt.charts.client.ChartType;
import com.googlecode.gwt.charts.client.ChartWrapper;
import com.googlecode.gwt.charts.client.ColumnType;
import com.googlecode.gwt.charts.client.DataTable;
import com.googlecode.gwt.charts.client.controls.Dashboard;
import com.googlecode.gwt.charts.client.controls.filter.ChartRangeFilter;
import com.googlecode.gwt.charts.client.controls.filter.ChartRangeFilterOptions;
import com.googlecode.gwt.charts.client.controls.filter.ChartRangeFilterState;
import com.googlecode.gwt.charts.client.controls.filter.ChartRangeFilterStateRange;
import com.googlecode.gwt.charts.client.controls.filter.ChartRangeFilterUi;
import com.googlecode.gwt.charts.client.corechart.LineChartOptions;
import com.googlecode.gwt.charts.client.options.ChartArea;
import com.googlecode.gwt.charts.client.options.Legend;
import com.googlecode.gwt.charts.client.options.LegendPosition;
import com.googlecode.gwt.charts.showcase.client.util.DateUtils;

public class ChartRangeFilterExample extends DockLayoutPanel {
    private Dashboard dashboard;
    private ChartWrapper lineChart;
    private ChartRangeFilter numberRangeFilter;

    public ChartRangeFilterExample() {
        super(Unit.PX);
        initialize();
    }

    private void initialize() {
        ChartLoader chartLoader = new ChartLoader(ChartPackage.CONTROLS);
        chartLoader.loadApi(new Runnable() {

            @Override
            public void run() {
                addNorth(getDashboardWidget(), 0);
                addSouth(getNumberRangeFilter(), 100);
                add(getLineChart());
                draw();
            }
        });
    }

    private Dashboard getDashboardWidget() {
        if (dashboard == null) {
            dashboard = new Dashboard();
        }
        return dashboard;
    }

    private ChartWrapper getLineChart() {
        if (lineChart == null) {
            lineChart = new ChartWrapper();
            lineChart.setChartType(ChartType.LINE);
        }
        return lineChart;
    }

    private ChartRangeFilter getNumberRangeFilter() {
        if (numberRangeFilter == null) {
            numberRangeFilter = new ChartRangeFilter();
        }
        return numberRangeFilter;
    }

    private void draw() {
        // Set control options
        ChartRangeFilterOptions chartRangeFilterOptions = ChartRangeFilterOptions.create();
        chartRangeFilterOptions.setFilterColumnIndex(0); // Filter by the date axis
        LineChartOptions controlChartOptions = LineChartOptions.create();
        controlChartOptions.setHeight(100);
        ChartArea chartArea = ChartArea.create();
        chartArea.setWidth("90%");
        chartArea.setHeight("90%");
        controlChartOptions.setChartArea(chartArea);
        ChartRangeFilterUi chartRangeFilterUi = ChartRangeFilterUi.create();
        chartRangeFilterUi.setChartType(ChartType.LINE);
        chartRangeFilterUi.setChartOptions(controlChartOptions);
        chartRangeFilterUi.setMinRangeSize(2 * 24 * 60 * 60 * 1000); // 2 days in milliseconds
        chartRangeFilterOptions.setUi(chartRangeFilterUi);
        ChartRangeFilterStateRange stateRange = ChartRangeFilterStateRange.create();
        stateRange.setStart(DateUtils.create(2012, 2, 9));
        stateRange.setEnd(DateUtils.create(2012, 3, 20));
        ChartRangeFilterState controlState = ChartRangeFilterState.create();
        controlState.setRange(stateRange);
        numberRangeFilter.setState(controlState);
        numberRangeFilter.setOptions(chartRangeFilterOptions);

        // Set chart options
        LineChartOptions lineChartOptions = LineChartOptions.create();
        lineChartOptions.setLineWidth(3);
        lineChartOptions.setLegend(Legend.create(LegendPosition.NONE));
        lineChartOptions.setChartArea(chartArea);
        lineChart.setOptions(lineChartOptions);

        // Generate random data
        DataTable dataTable = DataTable.create();
        dataTable.addColumn(ColumnType.DATE, "Date");
        dataTable.addColumn(ColumnType.NUMBER, "Stock value");
        dataTable.addRows(121);

        double open, close = 300;
        double low, high;
        for (int day = 1; day < 121; ++day) {
            double change = (Math.sin(day / 2.5 + Math.PI) + Math.sin(day / 3) - Math.cos(day * 0.7)) * 150;
            change = change >= 0 ? change + 10 : change - 10;
            open = close;
            close = Math.max(50, open + change);
            low = Math.min(open, close) - (Math.cos(day * 1.7) + 1) * 15;
            low = Math.max(0, low);
            high = Math.max(open, close) + (Math.cos(day * 1.3) + 1) * 15;
            dataTable.setValue(day, 0, DateUtils.create(2012, 1, day));
            dataTable.setValue(day, 1, Math.round(high));
        }

        // Draw the chart
        dashboard.bind(numberRangeFilter, lineChart);
        dashboard.draw(dataTable);
    }
}
输出:
