- MATLAB-绘图(1)
- MATLAB-绘图
- matlab 绘图点 - Matlab (1)
- matlab 绘图函数 (1)
- matlab 绘图点 - Matlab 代码示例
- matlab 绘图颜色 (1)
- 绘图的 MATLAB 颜色 (1)
- matlab 绘图函数 - 任何代码示例
- 在 matlab 上绘制绘图 (1)
- matlab 绘图顺序 (1)
- matlab绘图线顺序 (1)
- matlab 绘图颜色 - 任何代码示例
- MATLAB 中的 3D 绘图
- matlab如何标记绘图 (1)
- 绘图的 MATLAB 颜色 - 无论代码示例
- 带有运动的 matlab 绘图 - Matlab (1)
- matlab绘图线顺序 - 任何代码示例
- matlab 绘图顺序 - 任何代码示例
- 带有运动的 matlab 绘图 - Matlab 代码示例
- 在 matlab 上绘制绘图 - 无论代码示例
- matlab如何标记绘图 - 任何代码示例
- 如何将 matlab 绘图转换为乳胶 (1)
- matlab 全屏绘图 - 无论代码示例
- MATLAB – 详细绘图
- MATLAB – 详细绘图(1)
- matlab避免绘图以获得焦点 - Matlab(1)
- matlab避免绘图以获得焦点 - Matlab代码示例
- 如何将 matlab 绘图转换为乳胶 - 任何代码示例
- matlab 轴 - Matlab (1)
📅 最后修改于: 2021-01-07 02:29:45 🧑 作者: Mango
MATLAB绘图
绘图是数据集的图形表示,显示了两个或更多变量之间的关系。 MATLAB绘图在用于统计和数据分析的Math ,科学,工程,技术和金融领域起着至关重要的作用。
MATLAB中提供了几个函数来创建二维和3维图。
创建绘图
MATLAB使创建图变得容易。例如,在图2D中,是采取的矢量-坐标,=(A 1 …正),和b坐标- ,B的矢量=(B 1和… B n的),定位点(a i … b i ),其中i = 1,2。 。 n,然后通过直线将它们连接。
用于绘制图形的MATLAB命令为plot(a,b)。
向量a =(0,1,2,3,4,5,6,7,8,9,10)和b =(0,1,-1,1,0)产生如图所示的图像。
>> a = [1, 2, 3, 4, 5, 6, 7, 8, 9, 10];
>> b = [0, 1, -1, 1, 0];
>> plot(a, b)
示例:在区间[0,3π]上绘制函数sin(a),我们首先创建一个值范围为0到3π的向量,然后计算这些值的正弦值,最后绘制结果:
>>a = 0:pi/100:3*pi;     % range is same as used while creating vector
>>b = sin(a);
>>plot (a, b)
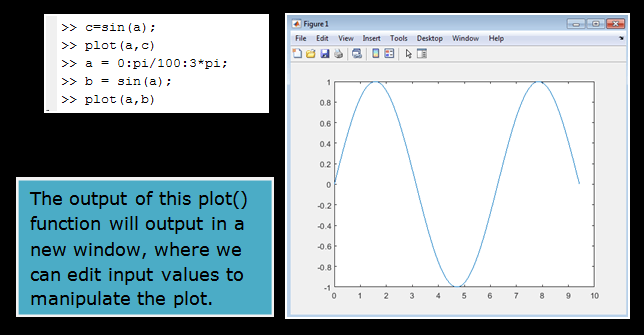
注意:0:pi / 100:3 * pi产生一个向量
- 从0开始
- 采取π/ 100的步长(或增量),
- 达到3π时停止。
- 如果忽略该增量,MATLAB会自动递增1。
添加标题,轴标签和注释
MATLAB允许我们添加轴标签和标题。例如,使用上一个示例中的图形,添加以及a和b标签。现在标记轴并添加标题。字符\ pi生成符号π。图中显示了2D图的示例。

>> xlabel('x = 0:2\pi')
>> ylabel('Sine of x')
>> title('Plot of the Sine function')
默认情况下,单个曲线的颜色是blue ,但是其他颜色也是可以的。所需的颜色由第三个参数表示。例如,通过曲线图(x,y,'r')选择红色。请注意,r周围的单引号“”。
创建多个图
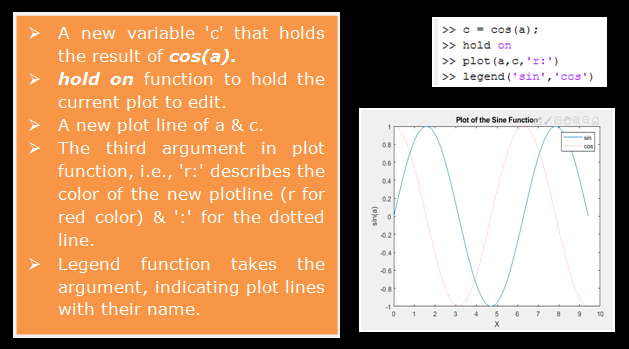
可以用多种方法创建多于一条线的图。下面的示例演示了该概念:
例:
a = 0: pi/100:2*pi;
 b=sin (a);
 c = cos (a);
plot (a, c, 'r:'), legend ('Sin(a)', 'Cos(a)')
图中显示了一个图表中多个数据集的输出
线条,颜色和标记样式
在绘图命令样式选项是一个<字符串>,它由指定的颜色和线型一个,两个或三个字符。有几种颜色,线条和标记样式选项:
| Color Style-option | Line Style option | Marker Style-option |
|---|---|---|
| y yellow | – Solid | + plus sign |
| m magenta | — dashed | 0 circle |
| c cyan | : dotted | * asterisk |
| r red | -. dash-dot | x x-mark |
| g green | none no line | . point |
| b blue | ^ up triangle | |
| w white | s square | |
| k black | d diamond, etc. |
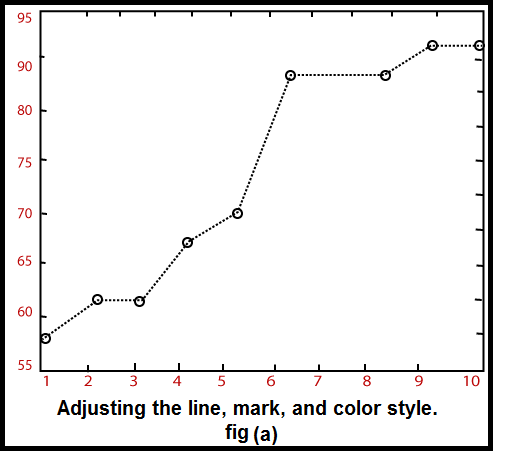
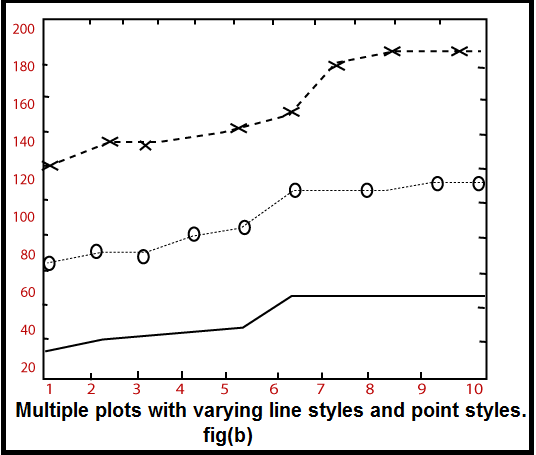
以下命令演示了线条,颜色和标记样式的用法:
x = [1:10];
y = [58.5, 63.8, 64.2, 67.3, 71.5, 88.3, 90.1, 90.6, 89.5, 90.4];
plot(x, y,':ok')
生成的图(a)由虚线以及标有圆圈的数据点组成。线,点和圆以黑色绘制,如图(b)所示。
设置轴比例尺和注释图
axis命令允许我们设置轴刻度。我们可以在以下方法中使用axis命令提供x和y轴的最小值和最大值
axis ( [xmin xmax ymin ymax] )
例
axis ([-5 10 2 22]);        sets x-axis from -5 to 10, y-axis from 2 to 22
axy = [-5 10 2 22]; axis (axy);
ax=[-5 10]; ay=[2 22]; axis ([ax ay]);
axis命令还有一些预定义的字符串参数:
| axis (‘equal’) | Sets equal scale on both axes |
| axis (‘square’) | Sets the default rectangular frame to the square |
| axis (‘normal’) | Resets the axis to default values |
| axis (‘axis’) | Freezes the current axis limits |
| axis (‘off’) | Delete the surrounding frame and the tick marks. |
生成子图
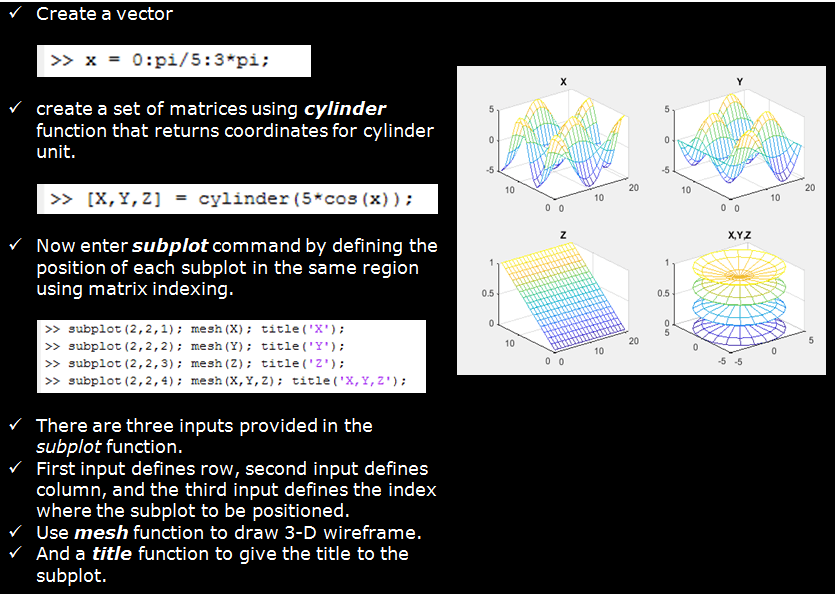
我们可以使用子图函数在同一窗口的不同子区域中显示多个图。 subplot命令需要三个整数参数:
subplot (m, n, p)
将图形拆分为mxn矩阵。变量p标识窗口的下一个绘图部分。例如,如果命令
subplot (2, 2, 1)
使用时,窗口分为两行和两列,并在左上方窗口中绘制该图。

图:子图用于将图窗口细分为mxn矩阵。
例:
