R中ggplot2中的上标和下标轴标签
在本文中,我们将看到如何在 R 编程语言中使用 ggplot2 中的上标和下标轴标签。
首先我们应该使用 library()函数加载 ggplot2 包。要安装和加载 ggplot2 包,请将以下命令写入 R 控制台。
# To Install ggplot2 package
# (Write this command to R Console)
install.packages("ggplot2")

# Load ggplot2 package
library("ggplot2")
现在,让我们创建一个 DataFrame。在这里,我们将创建一个简单的 DataFrame,其中包含两个名为 X 和 Y 的变量,然后将其分配给数据对象。我们将其命名为DF 。这里我们使用rnorm()函数为 x 和 y 轴生成了 10 个随机值。
# Load Package
library("ggplot2")

# Create a DataFrame
DF <- data.frame(X = rnorm(10),
                 Y = rnorm(10))
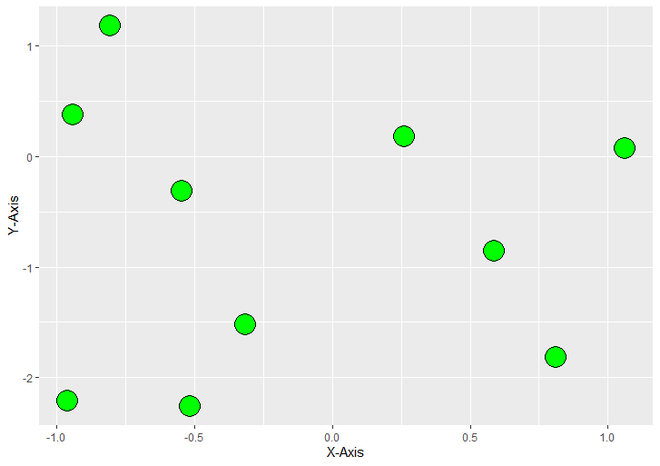
要创建 R 图,我们使用ggplot()函数,为了使其分散,我们将geom_point()函数添加到 ggplot()函数。这里我们使用一些参数size , fill , color , shape只是为了在 ScatterPlot 上更好地显示点。对于 X 和 Y 轴的标签,我们分别使用xlab()和ylab()函数。
句法:
xlab(“Label for X-Axis”)
ylab(“Label for Y-Axis”)
例子:
R
# Load Package
library("ggplot2")

# Create a DataFrame
DF <- data.frame(X = rnorm(10),
                 Y = rnorm(10))

# Create a ScatterPlot with simple labels
ggplot(DF,aes(X, Y))+
  geom_point(size = 8, fill = "green",
             color = "black", shape = 21)+
  xlab("X-Axis")+
  ylab("Y-Axis")
R
# Load ggplot2 Package
library("ggplot2")

# Create a DataFrame For Plotting
DF <- data.frame(X = rnorm(10),
                 Y = rnorm(10))

# Create ggplot2 ScatterPlot with SuperScripted
# value of Label of Axis.
ggplot(DF,aes(X, Y))+
  geom_point(size = 8, fill = "green",
             color = "black", shape = 21)+
  xlab(bquote(X-Axis^superscript))+
  ylab(bquote(Y-Axis^superscript))
R
# Load ggplot2 Package
library("ggplot2")

# Create a DataFrame For Plotting
DF <- data.frame(X = rnorm(10),
                 Y = rnorm(10))

# Create ggplot2 ScatterPlot with SubScripted
# value of Label of Axis.
ggplot(DF,aes(X, Y))+
  geom_point(size = 8, fill = "green",
             color = "black", shape = 21)+
  xlab(bquote(X-Axis[subscript]))+
  ylab(bquote(Y-Axis[subscript]))
输出:

带有简单轴标签的散点图
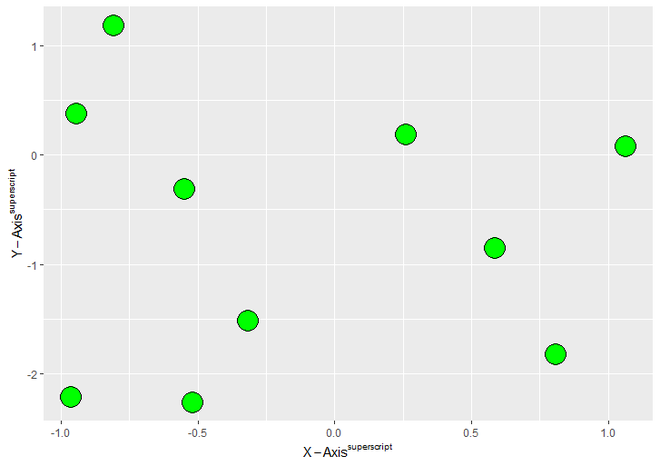
添加上标轴标签
现在我们将X的标签改为“ X轴上标”,Y改为“ Y轴上标”。因为bquote()函数用于引用传递给它的参数。
Syntax : bquote(expr)
Parameter :
- expr : language object
bquote() 对于 SuperScript :
bquote(math superscript(^) Notation)
例子:
电阻
# Load ggplot2 Package
library("ggplot2")

# Create a DataFrame For Plotting
DF <- data.frame(X = rnorm(10),
                 Y = rnorm(10))

# Create ggplot2 ScatterPlot with SuperScripted
# value of Label of Axis.
ggplot(DF,aes(X, Y))+
  geom_point(size = 8, fill = "green",
             color = "black", shape = 21)+
  xlab(bquote(X-Axis^superscript))+
  ylab(bquote(Y-Axis^superscript))
输出:

带有上标轴标签的散点图
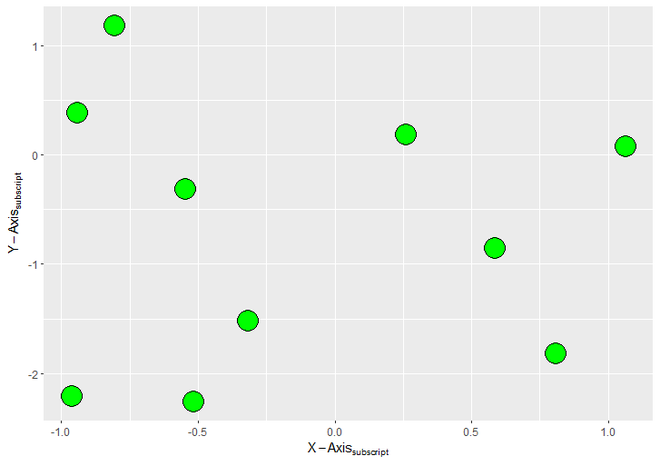
添加下标轴标签
我们将 X 的标签改为“ X-Axis下标” ”和Y到“ Y轴下标”。为此,我们将再次使用 bquote()函数,但对下标使用不同的数学符号。
bquote() 对于下标:
bquote(math subscript([]) Notation)
例子:
电阻
# Load ggplot2 Package
library("ggplot2")

# Create a DataFrame For Plotting
DF <- data.frame(X = rnorm(10),
                 Y = rnorm(10))

# Create ggplot2 ScatterPlot with SubScripted
# value of Label of Axis.
ggplot(DF,aes(X, Y))+
  geom_point(size = 8, fill = "green",
             color = "black", shape = 21)+
  xlab(bquote(X-Axis[subscript]))+
  ylab(bquote(Y-Axis[subscript]))
输出:

带有下标轴标签的散点图