在 Matplotlib 中绘制多个图
先决条件:Matplotlib
在 Matplotlib 中,我们可以通过两种方式在一个图中绘制多个图形。一种是使用 subplot()函数,另一种是将第二个图形叠加在第一个图形上,即所有图形都将出现在同一图形上。我们将一一研究这两种方式。
使用 subplot()函数绘制多幅图
subplot()函数是一个包装函数,它允许程序员只需调用一次就可以在一个图形中绘制多个图形。
Syntax: matplotlib.pyplot.subplots(nrows=1, ncols=1, sharex=False, sharey=False, squeeze=True, subplot_kw=None, gridspec_kw=None, **fig_kw)
Parameters:
- nrows, ncols: These gives the number of rows and columns respectively. Also, it must be noted that both these parameters are optional and the default value is 1.
- sharex, sharey: These parameters specify about the properties that are shared among a and y axis.Possible values for them can be, row, col, none or default value which is False.
- squeeze: This parameter is a boolean value specified, which asks the programmer whether to squeeze out, meaning remove the extra dimension from the array. It has a default value False.
- subplot_kw: This parameters allow us to add keywords to each subplot and its default value is None.
- gridspec_kw: This allows us to add grids on each subplot and has a default value of None.
- **fig_kw: This allows us to pass any other additional keyword argument to the function call and has a default value of None.
例子 :
Python3
# importing libraries
import matplotlib.pyplot as plt
import numpy as np
import math

# Get the angles from 0 to 2 pie (360 degree) in narray object
X = np.arange(0, math.pi*2, 0.05)

# Using built-in trigonometric function we can directly plot
# the given cosine wave for the given angles
Y1 = np.sin(X)
Y2 = np.cos(X)
Y3 = np.tan(X)
Y4 = np.tanh(X)

# Initialise the subplot function using number of rows and columns
figure, axis = plt.subplots(2, 2)

# For Sine Function
axis[0, 0].plot(X, Y1)
axis[0, 0].set_title("Sine Function")

# For Cosine Function
axis[0, 1].plot(X, Y2)
axis[0, 1].set_title("Cosine Function")

# For Tangent Function
axis[1, 0].plot(X, Y3)
axis[1, 0].set_title("Tangent Function")

# For Tanh Function
axis[1, 1].plot(X, Y4)
axis[1, 1].set_title("Tanh Function")

# Combine all the operations and display
plt.show()
Python3
# Importing libraries
import matplotlib.pyplot as plt
import numpy as np
import math

# Placing the plots in the plane
plot1 = plt.subplot2grid((3, 3), (0, 0), colspan=2)
plot2 = plt.subplot2grid((3, 3), (0, 2), rowspan=3, colspan=2)
plot3 = plt.subplot2grid((3, 3), (1, 0), rowspan=2)

# Using Numpy to create an array x
x = np.arange(1, 10)

# Plot for square root
plot2.plot(x, x**0.5)
plot2.set_title('Square Root')

# Plot for exponent
plot1.plot(x, np.exp(x))
plot1.set_title('Exponent')

# Plot for Square
plot3.plot(x, x*x)
plot.set_title('Square')

# Packing all the plots and displaying them
plt.tight_layout()
plt.show()
Python3
# Importing libraries
import matplotlib.pyplot as plt
import numpy as np
import math

# Using Numpy to create an array X
X = np.arange(0, math.pi*2, 0.05)

# Assign variables to the y axis part of the curve
y = np.sin(X)
z = np.cos(X)

# Plotting both the curves simultaneously
plt.plot(X, y, color='r', label='sin')
plt.plot(X, z, color='g', label='cos')

# Naming the x-axis, y-axis and the whole graph
plt.xlabel("Angle")
plt.ylabel("Magnitude")
plt.title("Sine and Cosine functions")

# Adding legend, which helps us recognize the curve according to it's color
plt.legend()

# To load the display window
plt.show()
输出
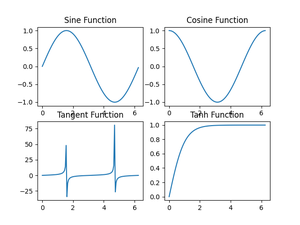
使用 subplot()函数绘制多个图
在 Matplotlib 中,还有一个与 subplot 非常相似的函数是 subplot2grid()。它与 subplot函数几乎相同,但提供了更大的灵活性,可以根据程序员的需要安排绘图对象。
这个函数的写法如下:
Syntax: matplotlib.pyplot.subplot2grid(shape, loc, rowspan=1, colspan=1, fig=None, **kwargs)
Parameter:
- shape
This parameter is a sequence of two integer values which tells the shape of the grid for which we need to place the axes. The first entry is for row, whereas the second entry is for column. - loc
Like shape parameter, even Ioc is a sequence of 2 integer values, where first entry remains for the row and the second is for column to place axis within grid. - rowspan
This parameter takes integer value and the number which indicates the number of rows for the axis to span to or increase towards right side. - colspan
This parameter takes integer value and the number which indicates the number of columns for the axis to span to or increase the length downwards. - fig
This is an optional parameter and takes Figure to place axis in. It defaults to current figure. - **kwargs
This allows us to pass any other additional keyword argument to the function call and has a default value of None.
例子 :
蟒蛇3
# Importing libraries
import matplotlib.pyplot as plt
import numpy as np
import math

# Placing the plots in the plane
plot1 = plt.subplot2grid((3, 3), (0, 0), colspan=2)
plot2 = plt.subplot2grid((3, 3), (0, 2), rowspan=3, colspan=2)
plot3 = plt.subplot2grid((3, 3), (1, 0), rowspan=2)

# Using Numpy to create an array x
x = np.arange(1, 10)

# Plot for square root
plot2.plot(x, x**0.5)
plot2.set_title('Square Root')

# Plot for exponent
plot1.plot(x, np.exp(x))
plot1.set_title('Exponent')

# Plot for Square
plot3.plot(x, x*x)
plot.set_title('Square')

# Packing all the plots and displaying them
plt.tight_layout()
plt.show()
输出
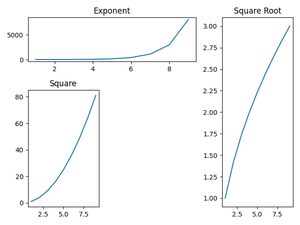
使用 subplot2grid()函数绘制多个图
在同一图中绘图
我们现在已经了解了如何使用 Matplotlib 库的 subplot 和 subplot2grid函数绘制多个图形。如前所述,我们现在将通过叠加来绘制多条曲线。在这种方法中,我们不使用任何特殊函数,而是直接将曲线绘制成一条曲线并尝试设置比例。
例子 :
蟒蛇3
# Importing libraries
import matplotlib.pyplot as plt
import numpy as np
import math

# Using Numpy to create an array X
X = np.arange(0, math.pi*2, 0.05)

# Assign variables to the y axis part of the curve
y = np.sin(X)
z = np.cos(X)

# Plotting both the curves simultaneously
plt.plot(X, y, color='r', label='sin')
plt.plot(X, z, color='g', label='cos')

# Naming the x-axis, y-axis and the whole graph
plt.xlabel("Angle")
plt.ylabel("Magnitude")
plt.title("Sine and Cosine functions")

# Adding legend, which helps us recognize the curve according to it's color
plt.legend()

# To load the display window
plt.show()
输出
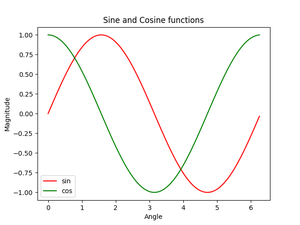
一张图中的正弦和余弦函数曲线