在 seaborn 中使用因子图绘制不同类型的图
先决条件: Seaborn 简介
Seaborn是一个惊人的Python统计图形绘图可视化库。它提供了漂亮的默认样式和调色板,使统计图更具吸引力。它建立在 matplotlib 库之上,并且与 pandas 的数据结构紧密集成。
因子图
Factor Plot用于绘制不同类型的categorical plot 。显示的默认图是点图,但我们可以使用kind参数绘制其他 seaborn 分类图,如箱形图、小提琴图、条形图或条形图。
注意:要查看 Pokemon 数据集文件,请单击此处
数据集片段: 
代码 1:使用 seaborn 的 factorplot() 方法进行点图。
# importing required library
import pandas as pd
import seaborn as sns
import matplotlib.pyplot as plt

# read a csv file
df = pd.read_csv('Pokemon.csv')

# Stage v / s Attack point plot
sns.factorplot(x ='Stage', y ='Attack', data = df)
sns.factorplot(x ='Stage', y ='Defense', data = df)

# Show the plots
plt.show()
输出: 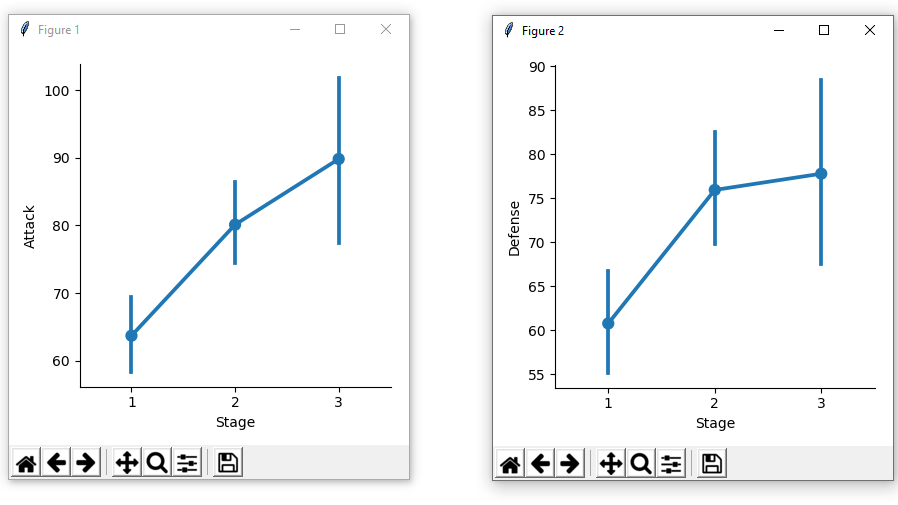
代码 2:使用 seaborn 的 factorplot() 方法的小提琴图。
# importing required library
import pandas as pd
import seaborn as sns
import matplotlib.pyplot as plt

# read a csv file
df = pd.read_csv('Pokemon.csv')

# Type 1 v / s Attack violin plot
sns.factorplot(x ='Type 1', y ='Attack',
               kind = 'violin', data = df)

# show the plots
plt.show()
输出: 
代码 3:使用 seaborn 的 factorplot() 方法的条形图。
# importing required library
import pandas as pd
import seaborn as sns
import matplotlib.pyplot as plt

# read a csv file
df = pd.read_csv('Pokemon.csv')

# Type 1 v / s Defense bar plot
# with Stage column is used for
# colour encoding i.e
# on the basis of Stages different
# colours is decided, here in this
# dataset, 3 Stage is mention so
# 3 different colours is used.
sns.factorplot(x ='Type 1', y ='Defense',
               kind = 'bar', hue = 'Stage',
               data = df)

# show the plots
plt.show()
输出: 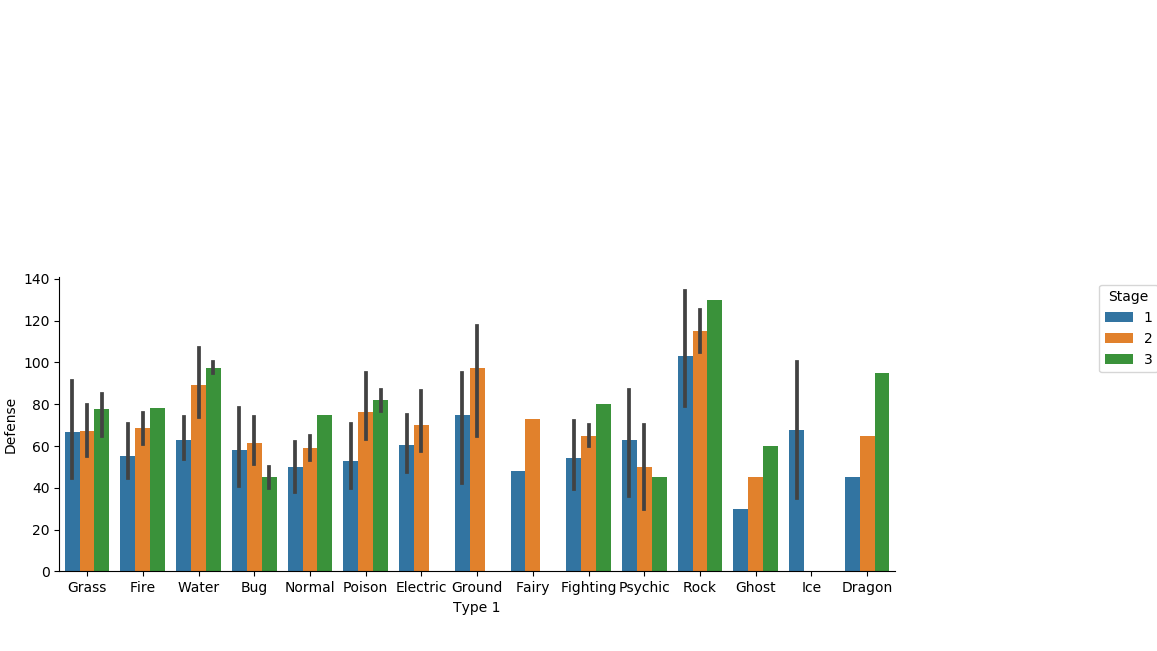
代码 4:使用 seaborn 的 factorplot() 方法的箱线图。
# importing required library
import pandas as pd
import seaborn as sns
import matplotlib.pyplot as plt

# read a csv file
df = pd.read_csv('Pokemon.csv')

# Stage v / s Defense box plot
sns.factorplot(x ='Stage', y ='Defense',
               kind = 'box', data = df)

# show the plots
plt.show()
输出: 
代码 5:使用 seaborn 的 factorplot() 方法的条形图。
# importing required library
import pandas as pd
import seaborn as sns
import matplotlib.pyplot as plt

# read a csv file
df = pd.read_csv('Pokemon.csv')

# Stage v / s Defense strip plot
sns.factorplot(x ='Stage', y ='Defense',
               kind = 'strip', data = df)

# show the plots
plt.show()
输出: 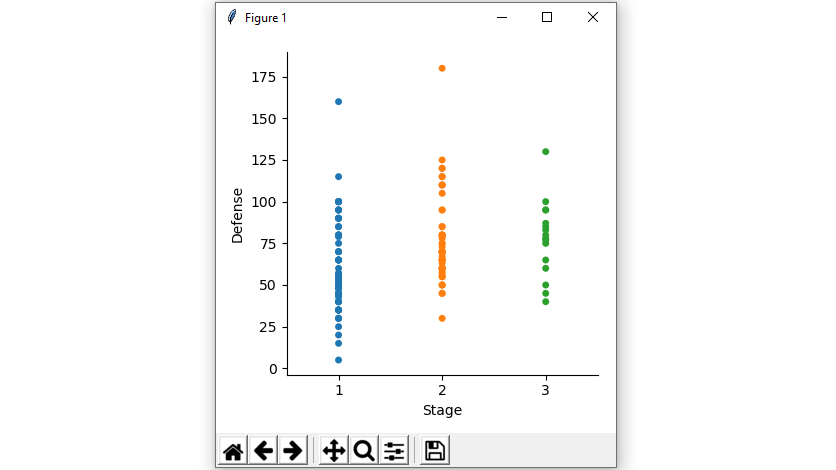
代码 6:使用 seaborn 的 factorplot() 方法计算图。
# importing required library
import pandas as pd
import seaborn as sns
import matplotlib.pyplot as plt

# read a csv file
df = pd.read_csv('Pokemon.csv')

# Stage v / s count - count plot
sns.factorplot(x ='Stage', kind = 'count', data = df)

# show the plots
plt.show()
输出: 