在 Pandas 中编写自定义聚合函数
Python中的Pandas广泛用于数据分析目的,它由一些精细的数据结构组成,如Dataframe和Series。 pandas 中有几个函数被证明对程序员有很大帮助,其中一个是聚合函数。此函数从作为输入的多个值返回单个值,这些值按特定条件组合在一起。一些聚合函数是平均值、计数、最大值等。
Syntax: DataFrame.agg(func=None, axis=0, *args, **kwargs)
Parameters:
- axis: {0 or ‘index’, 1 or ‘columns’} = 0 or ‘index’ means the function is applied to each column and 1 or ‘columns’ means the function is applied to each row.
- func: function, str, list or dict = It describes the function that is to be used for aggregation. Accepted combinations are: function, string function name (str), list of functions (list/dict).
- *args: It specifies the positional arguments to pass to the function.
- **kwargs: It specifies the keyword arguments to pass to the function.
Return: This function can return scalar, Series or Dataframe. The return is scalar when Series.agg is called with a single function, it is Series when Dataframe.agg is called with a single function, it will be Dataframe when Dataframe.agg is called with several functions.
让我们创建一个数据框:
Python3
# import pandas library
import pandas as pd

# create a Dataframe
df = pd.DataFrame([[10, 20, 30],
                  [40, 50, 60],
                  [70, 80, 90],
                  [100,110,120]],
                 columns=['Col_A', 'Col_B',
                          'Col_C'])
# show the dataframe
df
Python3
df.agg(['sum', 'min'])Python3
df.agg(['sum', 'min', 'max'])Python3
df.agg({'Col_A' : ['sum', 'min'],
        'Col_B' : ['min', 'max']})
Python3
df.agg({'Col_A' : ['sum', 'min'],
        'Col_B' : ['min', 'max'],
        'Col_C' : ['sum', 'mean']})
Python3
df.agg("mean", axis = "columns")Python3
# import pandas library
import pandas as pd

# Creating DataFrame
df = pd.DataFrame(
    {'stud_id' : [101, 102, 103, 104,
                  101, 102, 103, 104],
     'sub_code' : ['CSE6001', 'CSE6001', 'CSE6001',
                   'CSE6001', 'CSE6002', 'CSE6002',
                   'CSE6002', 'CSE6002'],
     'marks' : [77, 86, 55, 90,
                65, 90, 80, 67]}
)

# Printing DataFrame
df
Python3
# Importing reduce for
# rolling computations
from functools import reduce

# define a Custom aggregation
# function for finding total
def total(series):
      return reduce(lambda x, y: x + y, series)

# Grouping the output according to
# student id and printing the corresponding
# total marks and to check whether the
# output is correct or not, sum function
# is also used to print the sum.
df.groupby('stud_id').agg({'marks': ['sum', total]})
输出:

现在,让我们执行一些操作:
1. 对行执行聚合:这对 Dataframe 的行执行聚合函数。正如您在下面的示例中所看到的,示例 1 在聚合函数中有两个关键字 sum 和 min。 sum将每行的第一个(10,40,70,100),第二个(20,50,80,110)和第三个(30,60,90,120)元素分别相加并打印出来, min找到元素中的最小个数行并打印出来。第二个例子也有类似的过程。
示例 1:
Python3
df.agg(['sum', 'min'])
输出:

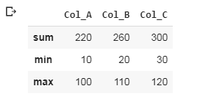
示例 2:
Python3
df.agg(['sum', 'min', 'max'])
输出:
2. 对列进行聚合:对列执行聚合函数,列的选择具体如示例所示。在第一个示例中,选择了两列,“Col_A”和“Col_B”,并对它们执行操作。对于 Col_A,计算最小值和总和值,对于 Col_B,计算最小值和最大值。与示例 2 类似的过程。
示例 1:
Python3
df.agg({'Col_A' : ['sum', 'min'],
        'Col_B' : ['min', 'max']})
输出:

示例 2:
Python3
df.agg({'Col_A' : ['sum', 'min'],
        'Col_B' : ['min', 'max'],
        'Col_C' : ['sum', 'mean']})
输出:

注意:如果未在特定列上执行特定聚合,它将打印 NaN。
3. 对列执行聚合:这对列执行聚合函数。如示例 1 所示,分别计算并打印每列的第一个 (10,20,30)、第二个 (40,50,60)、第三个 (70,80,90) 和第四个 (100,110,120) 元素的平均值并打印。
例子:
Python3
df.agg("mean", axis = "columns")
输出:

4 .自定义聚合函数:有时需要创建我们自己的聚合函数。
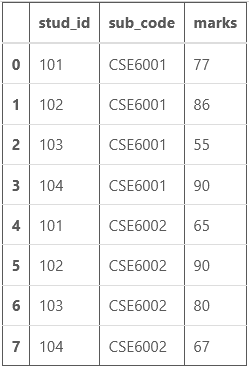
示例:考虑一个由学生 ID (stu_id)、学科代码 (sub_code) 和分数 (marks) 组成的数据框。
Python3
# import pandas library
import pandas as pd

# Creating DataFrame
df = pd.DataFrame(
    {'stud_id' : [101, 102, 103, 104,
                  101, 102, 103, 104],
     'sub_code' : ['CSE6001', 'CSE6001', 'CSE6001',
                   'CSE6001', 'CSE6002', 'CSE6002',
                   'CSE6002', 'CSE6002'],
     'marks' : [77, 86, 55, 90,
                65, 90, 80, 67]}
)

# Printing DataFrame
df
输出:
现在,如果您需要计算每个学生的总分(两个科目的分数)(唯一的 stu_id)。这个过程可以使用自定义聚合函数来完成。这里我的自定义聚合函数是“total”。
Python3
# Importing reduce for
# rolling computations
from functools import reduce

# define a Custom aggregation
# function for finding total
def total(series):
      return reduce(lambda x, y: x + y, series)

# Grouping the output according to
# student id and printing the corresponding
# total marks and to check whether the
# output is correct or not, sum function
# is also used to print the sum.
df.groupby('stud_id').agg({'marks': ['sum', total]})
输出:

如您所见,两列的总分值相同,因此我们的聚合函数在这种情况下正确计算了总分。