ggplot2 - R 中不同大小和颜色的标题和副标题
图表的标题和副标题提供了有关图表实际想要表示的图表的信息。本文介绍了如何在 R 编程中使用 ggplot2 添加不同大小和颜色的标题和副标题。
要在绘图中添加标题和副标题,首先,我们必须使用library()函数导入 ggplot2 库。如果您还没有安装,您可以通过在 R 控制台中编写命令install.packages(“ggplot2”)来简单地安装它。
library(ggplot2)考虑以下示例数据:
data <- data.frame(
  name=c("A","B","C","D","E") ,
  value=c(3,12,5,18,45)
)| Name | Value | |
|---|---|---|
| 1 | A | 3 |
| 2 | B | 12 |
| 3 | C | 5 |
| 4 | D | 18 |
| 5 | E | 45 |
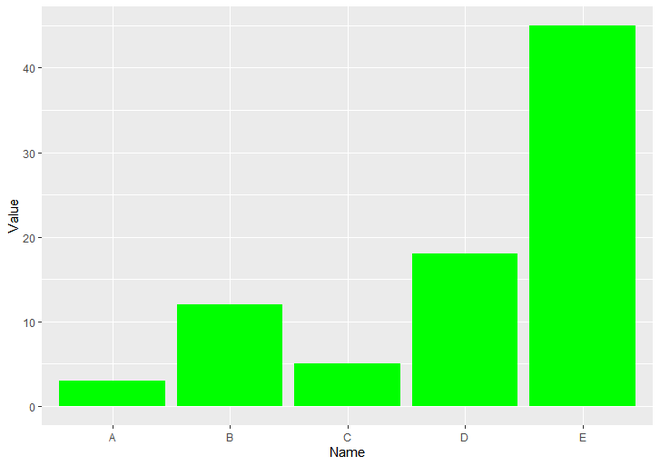
使用ggplot()函数创建一个绘图,其中 X 轴的值作为名称,Y 轴的值作为值,并使用 ggplot2 库的geom_bar()函数使其成为条形图。在这里,我们使用 geom_bar()函数的 fill 参数来为图的条形着色。
R
# Load Package
library(ggplot2)

# Create a Data
data <- data.frame(
  Name=c("A", "B", "C", "D", "E") ,
  Value=c(3, 12, 5, 18, 45)
)

# Create a Simple BarPlot with green color.
ggplot(data, aes(x = Name, y = Value)) +
  geom_bar(stat = "identity", fill = "green")
R
# Load Package
library(ggplot2)

# Create a Data
data <- data.frame(
  Name=c("A", "B", "C", "D", "E"),
  Value=c(3, 12, 5, 18, 45)
)

# Create a BarPlot and add title
# and subtitle to it using ggtitle() function.
ggplot(data, aes(x = Name, y = Value)) +
  geom_bar(stat = "identity", fill = "green")+
  ggtitle("Title For Barplot",
       subtitle = "This is Subtitle"
       )
R
# Load Package
library(ggplot2)

# Create Data
data <- data.frame(
  Name = c("A", "B", "C", "D", "E") ,
  Value = c(3, 12, 5, 18, 45)
)

# Create BarPlot and add title
# and subtitle to it using labs() function.
ggplot(data, aes(x = Name, y = Value)) +
  geom_bar(stat = "identity", fill = "green")+
  labs(title = "Title For Barplot",
       subtitle = "This is Subtitle"
       )
R
library(ggplot2)

data <- data.frame(
  Name = c("A", "B", "C", "D", "E") ,
  Value=c(3, 12, 5, 18, 45)
)

# Create a BarPlot with title
# of size 30 and subtitle of size 20
ggplot(data, aes(x = Name, y = Value)) +
  geom_bar(stat = "identity", fill = "green")+
  labs(title = "Title For Barplot",
       subtitle = "This is Subtitle"
       )+
  theme(plot.title = element_text(size = 30),
        plot.subtitle = element_text(size = 20)
        )
R
library(ggplot2)

data <- data.frame(
  Name = c("A", "B", "C", "D", "E") ,
  Value = c(3, 12, 5, 18, 45)
)

# Create a BarPlot with title
# and subtitle with different colors.
ggplot(data, aes(x = Name, y = Value)) +
  geom_bar(stat = "identity", fill = "green")+
  labs(title = "Title For Barplot",
       subtitle = "This is Subtitle"
       )+
  theme(plot.title = element_text(size = 30, color = "green"),
        plot.subtitle = element_text(size = 20, color = "red")
        )
输出:
将标题和副标题添加到 R 图
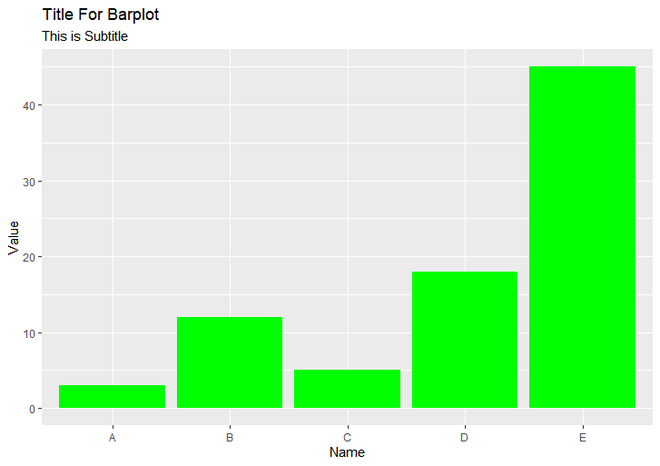
方法 1. 通过使用 ggtitle()函数:
为此,我们只需将ggtitle()函数添加到 geom_bar()函数。在 ggtitle()函数,我们可以不定义任何参数而直接编写我们想要添加到图中的标题,但是为了使用 ggtitle()函数将 Subtitle 添加到图中,我们必须使用subtitle参数到 ggtitle()函数然后将副标题分配给该参数。
Syntax : ggtitle(“Title of the Plot”, subtitle = “Subtitle of the Plot”)
Parameter :
- we give title that we want to add, as it’s parameter.
- subtitle is used as a second parameter of ggtitle() function to add subtitle of plot.
下面是实现:
电阻
# Load Package
library(ggplot2)

# Create a Data
data <- data.frame(
  Name=c("A", "B", "C", "D", "E"),
  Value=c(3, 12, 5, 18, 45)
)

# Create a BarPlot and add title
# and subtitle to it using ggtitle() function.
ggplot(data, aes(x = Name, y = Value)) +
  geom_bar(stat = "identity", fill = "green")+
  ggtitle("Title For Barplot",
       subtitle = "This is Subtitle"
       )
输出:
方法 2. 通过使用 labs()函数:
要使用 labs()函数将标题和副标题添加到 R Plot,事情与上面相同,唯一的区别是我们使用 labs()函数而不是 ggtitle()函数并将我们想要添加到名为“title”的参数的标题分配。可以使用与上述示例相同的参数添加字幕。输出也与上面的示例输出相同。
Syntax : ggtitle(“Title of the Plot”, subtitle = “Subtitle of the Plot”)
Parameter :
- title is used as a first parameter to add the title of Plot.
- subtitle is used as a second parameter to add the subtitle of Plot.
下面是实现:
电阻
# Load Package
library(ggplot2)

# Create Data
data <- data.frame(
  Name = c("A", "B", "C", "D", "E") ,
  Value = c(3, 12, 5, 18, 45)
)

# Create BarPlot and add title
# and subtitle to it using labs() function.
ggplot(data, aes(x = Name, y = Value)) +
  geom_bar(stat = "identity", fill = "green")+
  labs(title = "Title For Barplot",
       subtitle = "This is Subtitle"
       )
输出:
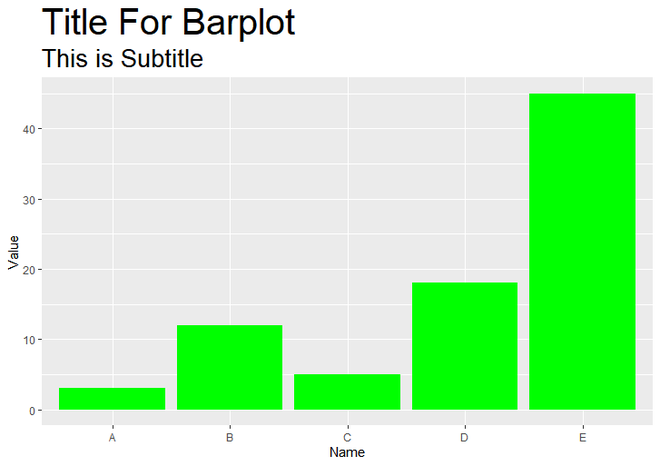
不同大小的标题和副标题
要更改标题和副标题的大小,我们将theme()函数添加到 labs() 或 ggtitle()函数,无论您使用什么。这里我们使用 labs()函数。在 theme()函数,我们使用plot.title参数对绘图标题进行更改,使用plot.subtitle对绘图副标题进行更改。我们使用element_text()函数作为 plot.title 和 plot.subtitle 参数的值。我们可以使用 element_text()函数更改文本的外观。要更改标题和副标题的大小,我们使用 element_text()函数的大小参数。这里我们设置标题大小为30,副标题大小为20。
下面是实现:
电阻
library(ggplot2)

data <- data.frame(
  Name = c("A", "B", "C", "D", "E") ,
  Value=c(3, 12, 5, 18, 45)
)

# Create a BarPlot with title
# of size 30 and subtitle of size 20
ggplot(data, aes(x = Name, y = Value)) +
  geom_bar(stat = "identity", fill = "green")+
  labs(title = "Title For Barplot",
       subtitle = "This is Subtitle"
       )+
  theme(plot.title = element_text(size = 30),
        plot.subtitle = element_text(size = 20)
        )
输出:
不同大小的标题和副标题
不同颜色的标题和副标题
要更改标题和副标题的颜色,我们只需在 element_text()函数添加一个颜色参数。其他的都和上面的实现一样。这里我们设置title颜色值为绿色,subtitle颜色值为红色。
电阻
library(ggplot2)

data <- data.frame(
  Name = c("A", "B", "C", "D", "E") ,
  Value = c(3, 12, 5, 18, 45)
)

# Create a BarPlot with title
# and subtitle with different colors.
ggplot(data, aes(x = Name, y = Value)) +
  geom_bar(stat = "identity", fill = "green")+
  labs(title = "Title For Barplot",
       subtitle = "This is Subtitle"
       )+
  theme(plot.title = element_text(size = 30, color = "green"),
        plot.subtitle = element_text(size = 20, color = "red")
        )
输出:
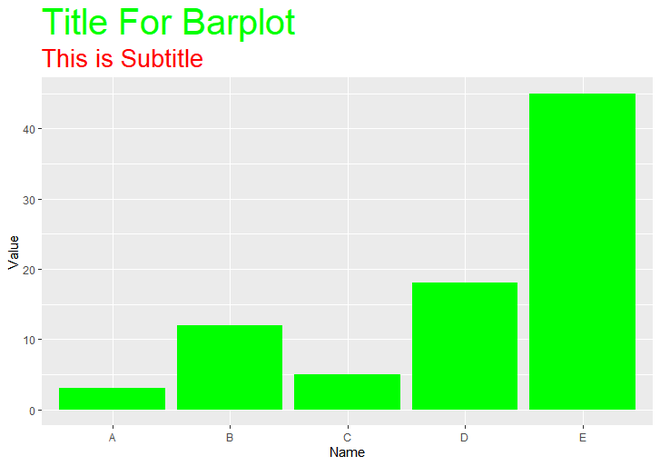
不同颜色的标题和副标题