如何更改 R 图中的轴间隔?
在本文中,我们将研究在 R 编程语言中更改轴间隔的不同方法。
方法 1:在基础 R 中使用 xlim() 和 ylim() 函数
在这种改变轴间隔的方法中,用户需要调用 xlim() 和 ylim() 函数,将用户需要的轴间隔范围的参数以向量的形式传递,这将改变轴根据用户在 R 编程语言中指定的参数,绘图的间隔。
xlim() 和 ylim()函数用于限制 x 轴和 y 轴。
Syntax:
xlim(…)
ylim(…)
Parameters:
…: If numeric, will create a continuous scale, if factor or character, will create a discrete scale.
句法:
barplot(data,xlim=c(),ylim=c())示例:初始图
R
gfg<-c(8,9,6,5,8,5,1,7,3,5)
barplot(gfg)
R
gfg<-c(8,9,6,5,8,5,1,7,3,5)
barplot(gfg,xlim=c(0,20), ylim=c(0,15))
R
gfg<-c(8,9,6,5,8,5,1,7,3,5)
barplot(gfg)
R
gfg<-c(8,9,6,5,8,5,1,7,3,5)
barplot(gfg,log='y')
R
gfg<-c(8,9,6,5,8,5,1,7,3,5)
barplot(gfg)
R
library(ggplot2)

gfg<-data.frame(x=c(8,9,6,5,8,5,1,7,3,5),
                y=c(9,6,5,4,2,5,6,7,4,1))

ggplot(data=gfg,aes(x=x, y=y)) + geom_point()+
xlim(0,15)+ylim(0,20)
R
library(ggplot2)

gfg<-data.frame(x=c(8,9,6,5,8,5,1,7,3,5),
                y=c(9,6,5,4,2,5,6,7,4,1))

ggplot(data=gfg,aes(x=x, y=y)) + geom_point()
R
library(ggplot2)

gfg<-data.frame(x=c(8,9,6,5,8,5,1,7,3,5),
                y=c(9,6,5,4,2,5,6,7,4,1))

ggplot(data=gfg,aes(x=x, y=y)) + geom_point()+
scale_y_continuous(trans = 'log10')
输出:
示例:更改轴间隔
R
gfg<-c(8,9,6,5,8,5,1,7,3,5)
barplot(gfg,xlim=c(0,20), ylim=c(0,15))
输出:
方法 2:在基础 R 中使用 log 参数
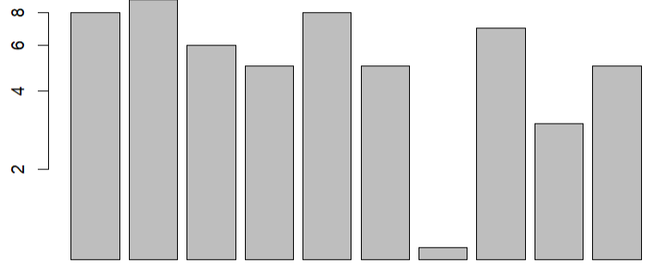
在这种更改给定绘图的轴间隔的方法中,用户需要使用带有绘图函数的日志参数将其中一个轴转换为对数刻度,这会将用户定义的轴更改为对数轴在 R 编程语言中。
句法:
barplot(data,log='x/y')示例:初始图
R
gfg<-c(8,9,6,5,8,5,1,7,3,5)
barplot(gfg)
输出:
示例:更改轴间隔
R
gfg<-c(8,9,6,5,8,5,1,7,3,5)
barplot(gfg,log='y')
输出:
方法 3:在 ggplot2 中使用 xlim() 和 ylim() 函数
在这种改变给定绘图轴间隔的方法中,用户需要在 R 编程语言的工作控制台中安装和导入 ggplot2 包,这里 ggplot2 包负责创建绘图,然后用户需要调用xlim() 和 ylim()函数具有根据用户所需的参数来更改用户需要的轴间隔,这些函数将使用 ggplot2 创建的图调用,这将导致绘制用户定义的轴间隔。
示例:初始图
R
gfg<-c(8,9,6,5,8,5,1,7,3,5)
barplot(gfg)
输出:
示例:更改轴间隔
R
library(ggplot2)

gfg<-data.frame(x=c(8,9,6,5,8,5,1,7,3,5),
                y=c(9,6,5,4,2,5,6,7,4,1))

ggplot(data=gfg,aes(x=x, y=y)) + geom_point()+
xlim(0,15)+ylim(0,20)
输出:
方法 4:将 scale_x_continuous() 和 scale_y_continuous() 函数与 ggplot2 一起使用
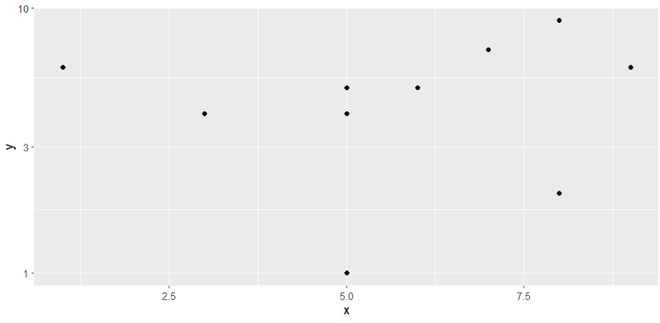
在这种更改轴间隔的方法中,用户需要在工作的 R 控制台中安装和导入 ggplot2 包,该包将负责绘图的绘制和使用一些功能。然后,用户需要调用 scale_x_continous() /scale_x_continous()函数,并使用所需参数绘制 ggplot2 图,以将轴间隔更改为 R 编程语言中的对数刻度。
scale_x_continuous() / scale_y_continuous()函数用于连续位置比例(x & y)。
Syntax:
scale_x_continuous(…, expand = waiver())
scale_y_continuous(…, expand = waiver())
Parameters:
- …: common continuous scale parameters: name, breaks, labels, na.value, limits and trans.
- expand: a numeric vector of length two giving multiplicative and additive expansion constants.
示例:初始图
R
library(ggplot2)

gfg<-data.frame(x=c(8,9,6,5,8,5,1,7,3,5),
                y=c(9,6,5,4,2,5,6,7,4,1))

ggplot(data=gfg,aes(x=x, y=y)) + geom_point()
输出:
示例:更改轴间隔
R
library(ggplot2)

gfg<-data.frame(x=c(8,9,6,5,8,5,1,7,3,5),
                y=c(9,6,5,4,2,5,6,7,4,1))

ggplot(data=gfg,aes(x=x, y=y)) + geom_point()+
scale_y_continuous(trans = 'log10')
输出:


