在 R 中为多个绘图添加公共主标题
在本文中,我们将研究在 R 编程语言中为基础 R 和 ggplot2 包中的多个绘图添加公共主标题的两种不同方法。
方法一:使用 par 和 mtext()函数
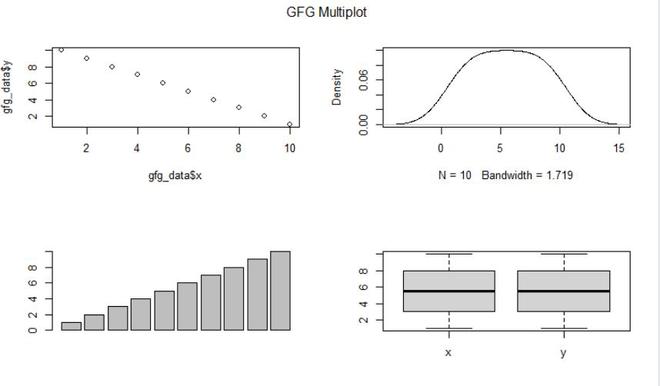
在这种为多个绘图添加公共主标题的方法中,用户需要调用 par() 和 mtext()函数,这是 R 编程语言的内置函数,这里用户还需要使用par函数的mfrow 参数并在两个函数中传递所需的参数,然后创建一个 nrows x ncols 图的矩阵,这将导致在单个图中形成多个图,并且 mtext()函数将添加文本写入在当前图形区域的四个边距之一中,这将导致在 R 编程语言中为多个绘图添加公共主标题。
- par()函数可用于设置或查询图形参数。
Syntax:
par(…, no.readonly = FALSE)
Parameter:
- …: arguments in tag = value form, or a list of tagged values.
- no.readonly: logical; if TRUE and there are no other arguments, only parameters are returned which can be set by a subsequent par() call on the same device.
- mtext()函数用于在当前图形区域的四个边距之一或设备区域的外边距之一写入文本
Syntax:
mtext(text, side = 3, line = 0, outer = FALSE, at = NA, adj = NA, padj = NA, cex = NA, col = NA,
font = NA, …)
Parameter:
- text: a character or expression vector specifying the text to be written. Other objects are coerced by as.graphicsAnnot.
- side: on which side of the plot (1=bottom, 2=left, 3=top, 4=right).
- line: on which MARgin line, starting at 0 countings outwards.
- outer: use outer margins if available.
- at: give the location of each string in user coordinates.
- adj: adjustment for each string in reading direction.
- padj: adjustment for each string perpendicular to the reading direction.
- cex: character expansion factor. NULL and NA are equivalent to 1.0.
- col: color to use. Can be a vector. NA values (the default) mean use par(“col”).
- font: font for text. Can be a vector. NA values (the default) mean use par(“font”).
- …: Further graphical parameters, including family, las and xpd.
例子:
使用中的数据:

R
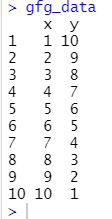
gfg_data <- data.frame(x = 1:10,y = 10:1)

par(mfrow = c(2, 2))

plot(gfg_data$x, gfg_data$y)
plot(density(gfg_data$x), main = "")

barplot(gfg_data$x)
boxplot(gfg_data)

mtext("GFG Multiplot", side = 3, line = - 2, outer = TRUE)
R
library("ggplot2")
library("patchwork")

gfg_data <- data.frame(x = 1:10,y = 10:1)

gfg_plot_1 <- ggplot(gfg_data, aes(x, y)) + geom_point()
gfg_plot_2 <- ggplot(gfg_data, aes(x)) +  geom_density()
gfg_plot_3 <- ggplot(gfg_data, aes(x)) +geom_boxplot()

gfg_plot <- (gfg_plot_1 + gfg_plot_2) / (gfg_plot_3 ) +
plot_annotation(title = "GFG Multiplot") &  theme(plot.title = element_text(hjust = 0.5))

gfg_plot
输出:

方法二:使用ggplot2和patchwork包
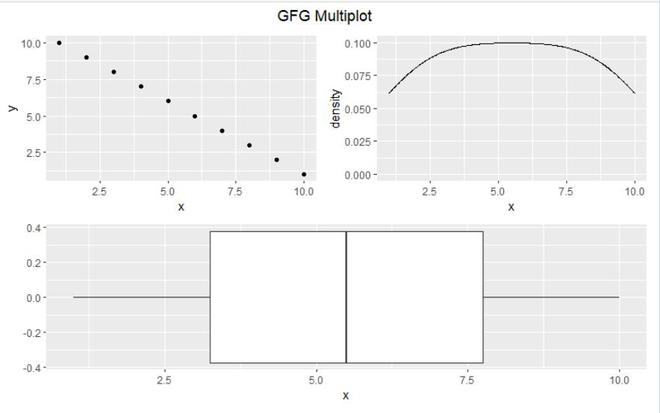
在这种为多个绘图添加公共主标题的方法中,用户首先需要在 R 控制台中安装并导入 ggplot2 和 patchwork 包,并且在 ggplot2 包的帮助下,用户将能够绘制多个绘图并使用在补丁包的帮助下并使用所需的参数调用 plot_annotation() ,用户将能够将公共主标题添加到由 ggplot2 包创建的多个绘图中,并进一步导致添加公共主标题对于多个地块。
plot_annotation()函数主要用于注释最终的拼凑而成。
Syntax:
plot_annotation( title = NULL, subtitle = NULL, caption = NULL, tag_levels = NULL, tag_prefix = NULL, tag_suffix = NULL, tag_sep = NULL, theme = NULL)
Parameters:
- title, subtitle, caption: Text strings to use for the various plot annotations.
- tag_levels: A character vector defining the enumeration format to use at each level.
- tag_prefix, tag_suffix: Strings that should appear before or after the tag.
- tag_sep: A separator between different tag levels
- theme: A ggplot theme specification to use for the plot. Only elements related to the titles as well as plot margin and background is used.
例子:
使用中的数据:

电阻
library("ggplot2")
library("patchwork")

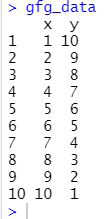
gfg_data <- data.frame(x = 1:10,y = 10:1)

gfg_plot_1 <- ggplot(gfg_data, aes(x, y)) + geom_point()
gfg_plot_2 <- ggplot(gfg_data, aes(x)) +  geom_density()
gfg_plot_3 <- ggplot(gfg_data, aes(x)) +geom_boxplot()

gfg_plot <- (gfg_plot_1 + gfg_plot_2) / (gfg_plot_3 ) +
plot_annotation(title = "GFG Multiplot") &  theme(plot.title = element_text(hjust = 0.5))

gfg_plot
输出:
