MATLAB 注释
MATLAB中的注释是一种向绘图添加解释或注释的方式。注释为绘图添加了更多信息。有不同的语法形式用于向绘图添加注释:
- 注释(线型,x,y)
- 注释(线型)
- 注释(形状类型,暗淡)
- 注释(形状类型)
- 注释(___,名称,值)
让我们详细讨论上述所有功能:
注释(线型,x,y)
- 在当前图形中的两点之间创建一条线或箭头注释。
- lineType 采用不同的值作为'line'、'arrow'、'doublearrow' 或 'textarrow'。
- x 和 y 分别是[x_begin x_end]和[y_begin y_end]形式的二元素向量。
- 注释的起点为(x_begin,y_begin) ,终点为(x_end,y_end) 。
例子 :
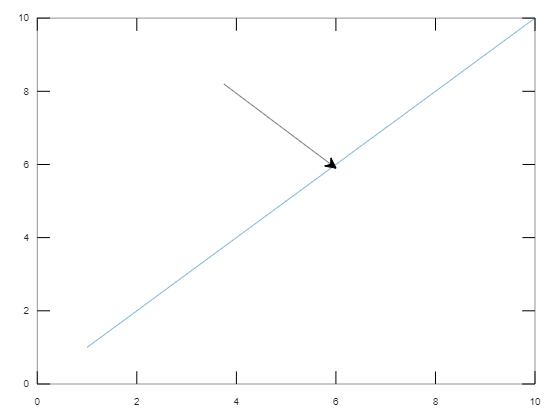
- 使用 plot(1:10) 绘制图形y = x 。
- 指定 x 和 y 值,即起点为(0.4, 0.8) ,终点为(0.6. 0.6)。
- 将 lineType 指定为'arrow',其中 x 和 y 为二元素向量。
Matlab
% Plots y = x line from 1 to 10
plot(1:10)

x = [0.4 0.6];
y = [0.8 0.6];

% annotation with lineType 'arrow'
annotation('arrow',x,y)
Matlab
% Plot y = -x from 1 to 10
x = [1:10]
y = -x
plot(x,y)

% annotation of lineType 'arrow'
% at default positions
annotation('arrow')
Matlab
% Plot y = x^2 from 0 to 10
x = [0:10]
y = x.*x
plot(x,y)

% Dimensions of textbox
dim = [0.2 0.3 0.3 0.3]
str = 'Parabola y = x^2';

% Annotation of shapeType 'textbox'
% at "dim" with "str"
% content inside the textbox
annotation('textbox',dim,'String',str);
Matlab
% Plot y = ^2 from 0 to 10
x = [0:10]
y = x.*x
plot(x,y)

% Annotation with shapeType='rectangle'
% with default positions
% of rectangle
annotation('rectangle');
Matlab
% Plot y = x^3 - 12x from -5 to +5
x = linspace(-5,5);
y = x.^3 - 12*x;
plot(x,y)

% Dimensions of eclipse
dim = [.3 .50 .25 .15];

% eclipse takes dimensions as it'll
% fit into specified
% rectangle dimension
% Anootation with color , FaceColoe and
% FaceALpha of eclipse
annotation('ellipse',dim,'color','red','FaceColor',
'green','FaceAlpha',.3)
输出 :
注释(线型)
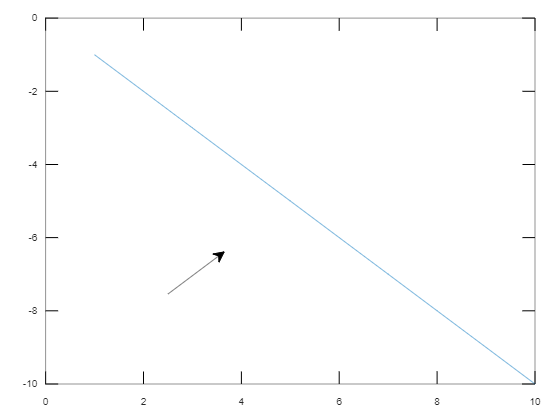
- 创建指定“lineType”的注释,默认位置从(0.3, 0.3)开始,到(0.4, 0.4)结束。
例子 :
- 绘制图形y = -x 。
- 将 lineType 指定为'arrow' 。
MATLAB
% Plot y = -x from 1 to 10
x = [1:10]
y = -x
plot(x,y)

% annotation of lineType 'arrow'
% at default positions
annotation('arrow')
输出 :
注释(形状类型,暗淡)
- 创建矩形或日食形状的注释,并为绘图提供暗淡。
- ShapeType 将值作为“矩形”、“椭圆”或“文本框”。
- dim是大小为 4 的向量[xywh] ,其中 (x, y) 是矩形的左下端点,w, h 分别是矩形的宽度和高度。
例子 :
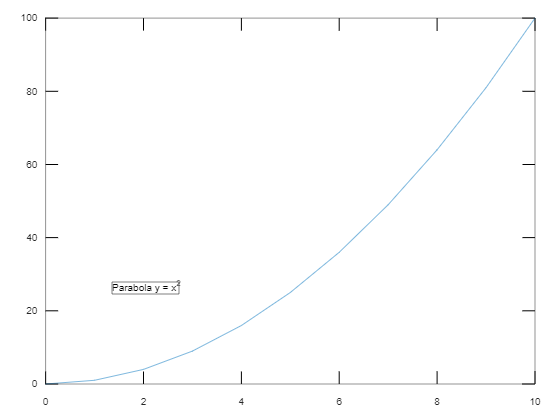
- 绘制从 0 到 10 的图形y=x^2 。
- 将dim指定为左下端点(0.2, 0.3) ,宽度和高度分别为0.3 和 0.3 。
- 通过在文本框中包含字符串来指定形状文本框的注释。
MATLAB
% Plot y = x^2 from 0 to 10
x = [0:10]
y = x.*x
plot(x,y)

% Dimensions of textbox
dim = [0.2 0.3 0.3 0.3]
str = 'Parabola y = x^2';

% Annotation of shapeType 'textbox'
% at "dim" with "str"
% content inside the textbox
annotation('textbox',dim,'String',str);
输出 :
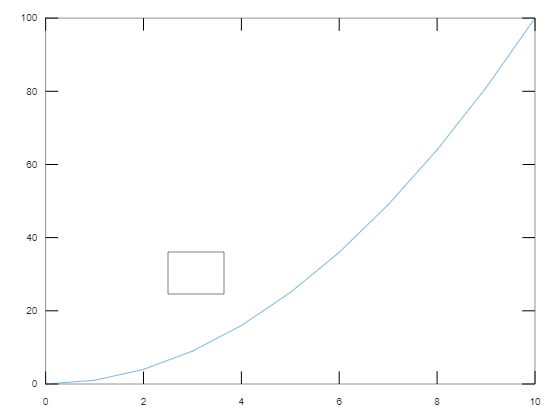
注释(形状类型)
- 在默认位置创建具有上述形状的注释,以便左下端点位于(0.3, 0.3)且宽度和高度均为0.1。
例子 :
- 绘制图形y = x^2。
- 使用矩形的默认位置创建 shapeType = 'rectangle'注释。
MATLAB
% Plot y = ^2 from 0 to 10
x = [0:10]
y = x.*x
plot(x,y)

% Annotation with shapeType='rectangle'
% with default positions
% of rectangle
annotation('rectangle');
输出 :
注释(___,名称,值)
- 通过将属性指定为名称-值对组参数来创建注释。
- 一些属性如String、color、FaceColor、FaceAlpha 等。
例子 :
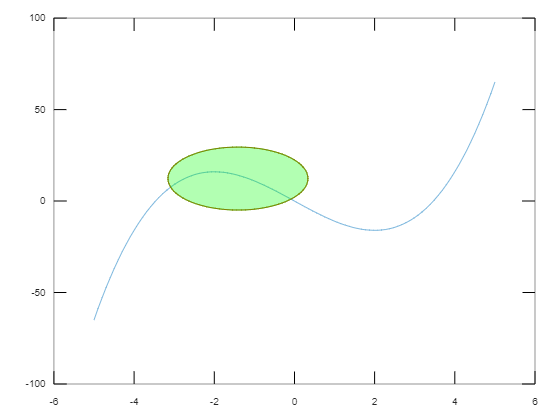
- 绘制图形y = x^3-12x。
- 将Eclipse注释指定为颜色为“红色” ,内部颜色为“绿色” , FaceAlpha = 0.3。指定 FaceColor 略微透明。
MATLAB
% Plot y = x^3 - 12x from -5 to +5
x = linspace(-5,5);
y = x.^3 - 12*x;
plot(x,y)

% Dimensions of eclipse
dim = [.3 .50 .25 .15];

% eclipse takes dimensions as it'll
% fit into specified
% rectangle dimension
% Anootation with color , FaceColoe and
% FaceALpha of eclipse
annotation('ellipse',dim,'color','red','FaceColor',
'green','FaceAlpha',.3)
输出 :