将每日数据聚合到 R DataFrame 中的月和年间隔
在本文中,我们将看到如何在 R 编程语言中的数据帧中聚合月和年间隔内的每日数据。
方法一:使用aggregate()方法
Base R 包含大量方法来对数据帧执行操作。 R 中的 seq() 方法用于生成从预定义值开始的规则序列。
Syntax: seq(from , to , by , length.out)
Arguments :
- from – The value from where to begin the sequence. The as.Date() method is used here, in order to generate a sequence of dates until the length of the sequence is met.
- to – The value where to end the sequence.
- by – The parameter to increment the sequence. “day” is used as a parameter here, in order to generate successive dates in order.
- length.out – The total length of the sequence.
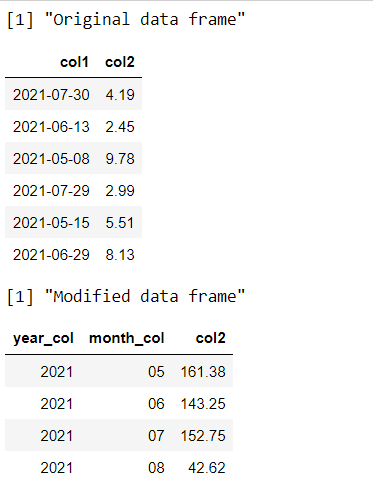
然后使用来自作为第 1 列生成的此日期序列的样本形成数据帧。使用 rnorm() 方法生成该值以生成随机浮点数。
然后将的strftime()方法被用于一个时间对象转换为回来。可以指定格式以提取日期对象的不同组件。
Syntax: strftime (date, format)
Arguments :
- date – The object to be converted
- format – We use %m to extract the month and %Y to extract the year in YYYY format.
为了聚合数据,使用聚合方法,该方法用于计算每个组的汇总统计。
Syntax: aggregate ( formula , data , FUN)
Arguments :
- formula – a formula, such as y ~ x
- data – The dataframe over which to apply the function
- FUN – The function to be applied to the dataframe. Here, the function applied is sum in order to perform the aggregation or summation over the values belonging to same group.
代码:
R
set.seed(99923)

# creating dataframe
# specifying number of rows
len <- 100

# creating sequences of dates
var_seq <- seq(as.Date("2021/05/01"),
               by = "day",
               length.out = len)

# creating columns for dataframe
data_frame <- data.frame(col1 = sample( var_seq,
                                 100, replace = TRUE),
                   col2 = round(rnorm(10, 5, 2), 2))
print("Original dataframe")
head(data_frame)

# creating new year column for dataframe
data_frame$year_col <- strftime(data_frame$col1, "%Y")

# creating new month column for dataframe
data_frame$month_col <- strftime(data_frame$col1, "%m")

# aggregating the daily data
data_frame_mod <- aggregate(col2 ~ year_col + month_col,
                        data_frame,
                        FUN = sum)
print("Modified dataframe")
head(data_frame_mod)
R
library("dplyr")
library("lubridate")
set.seed(99923)

# creating dataframe
# specifying number of rows
len <- 100

# creating sequences of dates
var_seq <- seq(as.Date("2021/05/01"),
               by = "day",
               length.out = len)

# creating columns for dataframe
data_frame <- data.frame(col1 = sample( var_seq,
                                 100, replace = TRUE),
                   col2 = round(rnorm(10, 5, 2), 2))
print("Original dataframe")
head(data_frame)

# creating new month column for dataframe
data_frame$month_year_col <- floor_date(data_frame$col1,
                                   "month")
# aggregating the daily data
data_frame_mod <- data_frame %>%
  group_by(month_year_col) %>%
  dplyr::summarize(col2 = sum(col2)) %>%
  as.data.frame()

print("Modified dataframe")
head(data_frame_mod)
输出:

方法 2:使用 lubridate 和 dplyr 包
R 中的 Lubridate 包用于为日期和时间对象提供更简单的工作机制。它可以使用以下命令加载并安装在工作空间中:
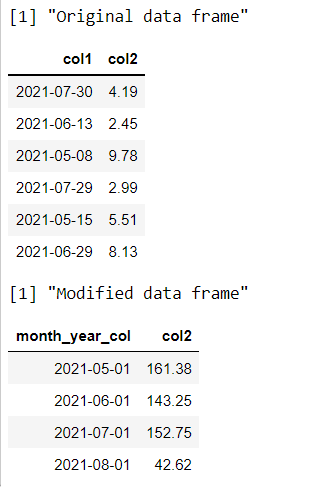
install.packages("lubridate")R 中的 floor_date() 方法使用日期时间对象,可以是单个实体或日期时间对象的向量,然后在指定的时间单位内进一步将其四舍五入为最接近的整数值。
floor_date(x , unit = months)dplyr 包用于执行数据操作和统计。它可以使用以下命令加载并安装在工作空间中:
install.packages("dplyr")通过在一系列操作和方法上使用管道运算符来修改数据帧。 group_by() 方法用于根据指定列中包含的值对数据进行分组。
group_by(col1,..)然后使用汇总()方法执行汇总统计,该方法对第三列中包含的值执行求和。然后使用 as.data.frame() 方法将结果处理到数据帧中。
代码:
电阻
library("dplyr")
library("lubridate")
set.seed(99923)

# creating dataframe
# specifying number of rows
len <- 100

# creating sequences of dates
var_seq <- seq(as.Date("2021/05/01"),
               by = "day",
               length.out = len)

# creating columns for dataframe
data_frame <- data.frame(col1 = sample( var_seq,
                                 100, replace = TRUE),
                   col2 = round(rnorm(10, 5, 2), 2))
print("Original dataframe")
head(data_frame)

# creating new month column for dataframe
data_frame$month_year_col <- floor_date(data_frame$col1,
                                   "month")
# aggregating the daily data
data_frame_mod <- data_frame %>%
  group_by(month_year_col) %>%
  dplyr::summarize(col2 = sum(col2)) %>%
  as.data.frame()

print("Modified dataframe")
head(data_frame_mod)
输出:
