在 R 中设置 ggplot2 Facet Plot 的轴限制 – ggplot2
在本文中,我们将讨论如何在 R 编程语言中设置 ggplot2 刻面图的轴限制。
方法 1:使用 Free Scales 设置 ggplot2 刻面图的轴限制
这里 ggplot2 包的作用是绘制分面图并为用户提供一些功能,进一步用户需要将 scales函数的参数设置为“free”,这将自由设置分面 ggplot2 图的轴范围.
刻度函数:
这是一个通用函数,其默认方法居中和/或缩放数字矩阵的列。
Syntax: scale(x, center = TRUE, scale = TRUE)
Parameters:
- x: a numeric matrix
- center: either a logical value or numeric-alike vector of length equal to the number of columns of x
- scale: either a logical value or a numeric-alike vector of length equal to the number of columns of x.
例子:
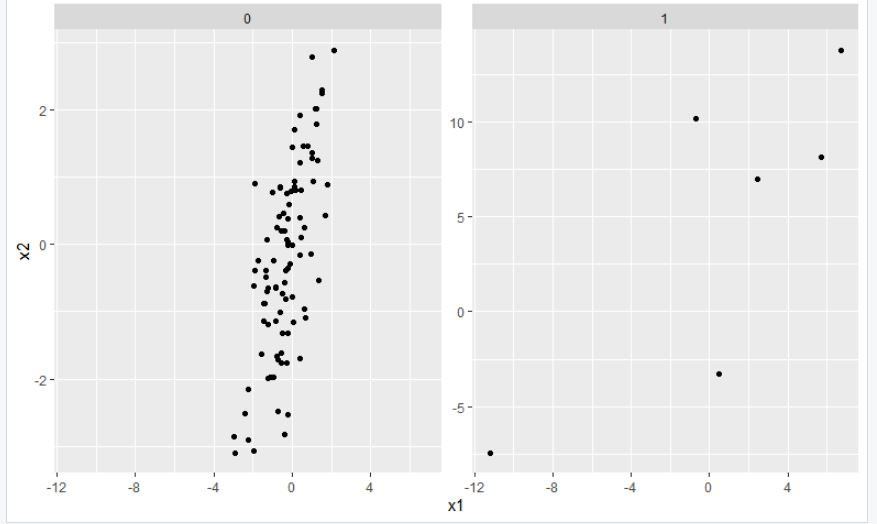
在此示例中,我们将查看使用 100 个随机数据点创建的分面图,然后在自由缩放方法的帮助下,我们将在 R 编程语言中限制分面 ggplot2 的轴。
设置轴限制的初始图:

代码:
R
# load ggplot2
library("ggplot2")
# Data from the facet plot
x1 < -rnorm(100)
x2 < -rnorm(100)+x1
grp < - rbinom(100, 1, 0.1)
x1[grp == 1] < - x1[grp == 1] * 5
x2[grp == 1] < - x2[grp == 1] * 5
# Data from the facet plot
gfg < - data.frame(x1, x2, grp)
# facet plot with facet_wrap
gfg_plot < - ggplot(gfg, aes(x1, x2)) +
geom_point() + facet_wrap(~ grp)
# Draw plot with free scales
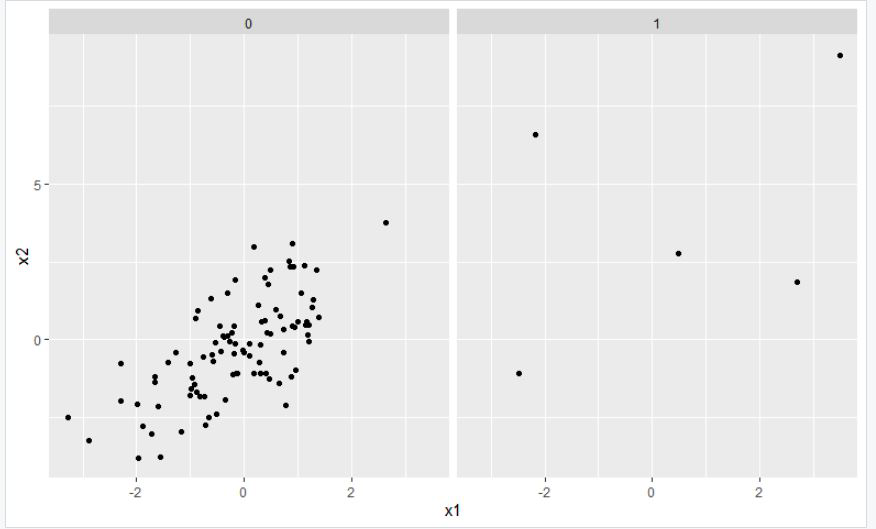
gfg_plot + facet_wrap(~ grp, scales="free")R
# load ggplot2
library("ggplot2")

# Data from the facet plot
x1 < -rnorm(100)
x2 < -rnorm(100)+x1
grp < - rbinom(100, 1, 0.1)
x1[grp == 1] < - x1[grp == 1] * 5
x2[grp == 1] < - x2[grp == 1] * 5

# Data from the facet plot
gfg < - data.frame(x1, x2, grp)

# facet plot with facet_wrap
gfg_plot < - ggplot(gfg, aes(x1, x2)) +
geom_point() + facet_wrap(~ grp)

# Draw plot with free x-axis scales
gfg_plot + facet_wrap(~ grp, scales="free_x")
R
# load ggplot2
library("ggplot2")

# Data from the facet plot
x1 < -rnorm(100)
x2 < -rnorm(100)+x1
grp < - rbinom(100, 1, 0.1)

x1[grp == 1] < - x1[grp == 1] * 5
x2[grp == 1] < - x2[grp == 1] * 5

# Data from the facet plot
gfg < - data.frame(x1, x2, grp)

# facet plot with facet_wrap
gfg_plot < - ggplot(gfg, aes(x1, x2)) +
geom_point() + facet_wrap(~ grp)

# Draw plot with free y-axis scales
gfg_plot + facet_wrap(~ grp, scales="free_y")
R
# load ggplot2
library("ggplot2")

# Data from the facet plot
x1<-rnorm(100)
x2<-rnorm(100)+x1
grp <- rbinom(100, 1, 0.1)
x1[grp == 1] <- x1[grp == 1] * 5
x2[grp == 1] <- x2[grp == 1] * 5

# Data from the facet plot
gfg <- data.frame(x1,x2, grp)

# facet plot with facet_wrap
gfg_plot <- ggplot(gfg, aes(x1,x2)) +
geom_point() +  facet_wrap(~ grp)
gfg_plot + facet_wrap(~ grp, scales = "free_x")+coord_cartesian(ylim = c(-20,20))
输出:

方法 2:使用自由 X 轴设置 ggplot2 刻面图的轴限制
这里 ggplot2 包的作用是绘制平面图并为用户提供一些功能,进一步用户需要将 scales函数的参数设置为“free_x”,这将自由设置 x 轴的轴范围facet ggplot2 图和剩余的 y 轴将保持不变。
例子:
在此示例中,我们将查看使用 100 个随机数据点创建的构面图,然后借助免费的 X 轴缩放方法,其中绘图的 x 轴将更改限制和剩余的 y-在 R 编程语言中,轴将保持不变 ggplot2 方面。
设置轴限制的初始图:

代码:
R
# load ggplot2
library("ggplot2")

# Data from the facet plot
x1 < -rnorm(100)
x2 < -rnorm(100)+x1
grp < - rbinom(100, 1, 0.1)
x1[grp == 1] < - x1[grp == 1] * 5
x2[grp == 1] < - x2[grp == 1] * 5

# Data from the facet plot
gfg < - data.frame(x1, x2, grp)

# facet plot with facet_wrap
gfg_plot < - ggplot(gfg, aes(x1, x2)) +
geom_point() + facet_wrap(~ grp)

# Draw plot with free x-axis scales
gfg_plot + facet_wrap(~ grp, scales="free_x")
输出:

方法 3:使用 Free Y 轴设置 ggplot2 刻面图的轴限制
这里 ggplot2 包的作用是绘制平面图并为用户提供一些功能,进一步用户需要将 scales函数的参数设置为“free_y”,这将自由设置 y 轴的轴限制facet ggplot2 图和剩余的 x 轴将保持不变。
例子:
在此示例中,我们将查看使用 100 个随机数据点创建的分面图,然后借助免费的 Y 轴缩放方法,其中图的 y 轴将更改限制,剩余的 x-在 R 编程语言中,轴将保持不变 ggplot2 方面。
设置轴限制的初始图:

代码:
R
# load ggplot2
library("ggplot2")

# Data from the facet plot
x1 < -rnorm(100)
x2 < -rnorm(100)+x1
grp < - rbinom(100, 1, 0.1)

x1[grp == 1] < - x1[grp == 1] * 5
x2[grp == 1] < - x2[grp == 1] * 5

# Data from the facet plot
gfg < - data.frame(x1, x2, grp)

# facet plot with facet_wrap
gfg_plot < - ggplot(gfg, aes(x1, x2)) +
geom_point() + facet_wrap(~ grp)

# Draw plot with free y-axis scales
gfg_plot + facet_wrap(~ grp, scales="free_y")
输出:
方法 4:使用单个轴设置 ggplot2 平面图的轴限制
在这里,用户需要将 scales函数的参数设置为“free_x”,这将自由设置 facet ggplot2 绘图的 y 轴的轴范围,其余的 x 轴将使用 ylim函数进行更改,即手动设置绘图轴。
例子:
在此示例中,我们将查看使用 100 个随机数据点创建的构面图,然后借助免费的 X 轴缩放方法,其中绘图的 x 轴将更改限制和剩余的 y-轴将在 ylim()函数的帮助下更改,即 R 编程语言中的 facet ggplot2。
设置轴限制的初始图:-
代码:
R
# load ggplot2
library("ggplot2")

# Data from the facet plot
x1<-rnorm(100)
x2<-rnorm(100)+x1
grp <- rbinom(100, 1, 0.1)
x1[grp == 1] <- x1[grp == 1] * 5
x2[grp == 1] <- x2[grp == 1] * 5

# Data from the facet plot
gfg <- data.frame(x1,x2, grp)

# facet plot with facet_wrap
gfg_plot <- ggplot(gfg, aes(x1,x2)) +
geom_point() +  facet_wrap(~ grp)
gfg_plot + facet_wrap(~ grp, scales = "free_x")+coord_cartesian(ylim = c(-20,20))
输出:
