在 Matplotlib 中并排放置图
Matplotlib 是最流行的Python库,用于绘制图形和可视化我们的数据。在 Matplotlib 中,我们可以通过调用一次来创建多个图。为了创建多个图,我们使用 Matplotlib 中 pyplot 模块的 subplot函数。
Syntax: plt.subplot(nrows, .ncolumns, index)
Parameters:
- nrows is for number of rows means if the row is 1 then the plots lie horizontally.
- ncolumns stands for column means if the column is 1 then the plot lie vertically.
- and index is the count/index of plots. It starts with 1.
方法:
- 导入库和模块。
- 为绘图创建数据。
- 现在,使用上面的函数创建一个子图。
- 根据需要给函数赋予参数。
示例 1:
Python3
# importing libraries
import numpy as np
import matplotlib.pyplot as plt
# creating an array of data for x-axis
x = np.array([2, 4, 6, 8, 10, 12, 14, 16, 18, 20])
# data for y-axis
y_1 = 2*x
# dat for y-axis for another plot
y_2 = 3*x
# using subplot function and creating plot one
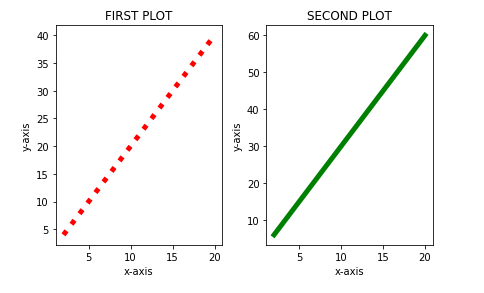
plt.subplot(1, 2, 1) # row 1, column 2, count 1
plt.plot(x, y_1, 'r', linewidth=5, linestyle=':')
plt.title('FIRST PLOT')
plt.xlabel('x-axis')
plt.ylabel('y-axis')
# using subplot function and creating plot two
# row 1, column 2, count 2
plt.subplot(1, 2, 2)
# g is gor green color
plt.plot(x, y_2, 'g', linewidth=5)
plt.title('SECOND PLOT')
plt.xlabel('x-axis')
plt.ylabel('y-axis')
# space between the plots
plt.tight_layout(4)
# show plot
plt.show()Python3
# importing libraries
import numpy as np
import matplotlib.pyplot as plt

# creating an array of data for x-axis
x = np.array([2, 4, 6, 8, 10, 12, 14, 16, 18, 20])

# data for y-axis
y_1 = 2*x

# dat for y-axis for another plot
y_2 = 3*x

# using subplot function and creating plot one
# row 2, column 1, count 1
plt.subplot(2, 1, 1)
plt.plot(x, y_1, 'r', linewidth=5, linestyle=':')
plt.title('FIRST PLOT')
plt.xlabel('x-axis')
plt.ylabel('y-axis')

# using subplot function and creating plot two
# row 2, column 1, count 2
plt.subplot(2, 1, 2)
plt.plot(x, y_2, 'g', linewidth=5)
plt.title('SECOND PLOT')
plt.xlabel('x-axis')
plt.ylabel('y-axis')

# space between the plots
plt.tight_layout()

# show plot
plt.show()
Python3
# importing libraries
import numpy as np
import matplotlib.pyplot as plt

# creating an array of data for x-axis
x = np.array([2, 4, 6, 8, 10, 12, 14, 16, 18, 20])

# data for y-axis
y_1 = 2*x

# dat for y-axis for another plot
y_2 = 3*x

# figsize() function to adjust the size
# og function
plt.subplots(figsize=(15, 5))

# using subplot function and creating
# plot one
plt.subplot(1, 2, 1)
plt.plot(x, y_1, 'r', linewidth=5, linestyle=':')
plt.title('FIRST PLOT')
plt.xlabel('x-axis')
plt.ylabel('y-axis')

# using subplot function and creating plot two
plt.subplot(1, 2, 2)
plt.plot(x, y_2, 'g', linewidth=5)
plt.title('SECOND PLOT')
plt.xlabel('x-axis')
plt.ylabel('y-axis')

# space between the plots
plt.tight_layout(4)

# show plot
plt.show()
输出:
示例 2:垂直形式。
蟒蛇3
# importing libraries
import numpy as np
import matplotlib.pyplot as plt

# creating an array of data for x-axis
x = np.array([2, 4, 6, 8, 10, 12, 14, 16, 18, 20])

# data for y-axis
y_1 = 2*x

# dat for y-axis for another plot
y_2 = 3*x

# using subplot function and creating plot one
# row 2, column 1, count 1
plt.subplot(2, 1, 1)
plt.plot(x, y_1, 'r', linewidth=5, linestyle=':')
plt.title('FIRST PLOT')
plt.xlabel('x-axis')
plt.ylabel('y-axis')

# using subplot function and creating plot two
# row 2, column 1, count 2
plt.subplot(2, 1, 2)
plt.plot(x, y_2, 'g', linewidth=5)
plt.title('SECOND PLOT')
plt.xlabel('x-axis')
plt.ylabel('y-axis')

# space between the plots
plt.tight_layout()

# show plot
plt.show()
输出:

为了增加图的大小,我们可以这样写
plt.subplots(figsize(l, b))示例 3:
蟒蛇3
# importing libraries
import numpy as np
import matplotlib.pyplot as plt

# creating an array of data for x-axis
x = np.array([2, 4, 6, 8, 10, 12, 14, 16, 18, 20])

# data for y-axis
y_1 = 2*x

# dat for y-axis for another plot
y_2 = 3*x

# figsize() function to adjust the size
# og function
plt.subplots(figsize=(15, 5))

# using subplot function and creating
# plot one
plt.subplot(1, 2, 1)
plt.plot(x, y_1, 'r', linewidth=5, linestyle=':')
plt.title('FIRST PLOT')
plt.xlabel('x-axis')
plt.ylabel('y-axis')

# using subplot function and creating plot two
plt.subplot(1, 2, 2)
plt.plot(x, y_2, 'g', linewidth=5)
plt.title('SECOND PLOT')
plt.xlabel('x-axis')
plt.ylabel('y-axis')

# space between the plots
plt.tight_layout(4)

# show plot
plt.show()
输出:
