将多行文本注释到 R 中的 ggplot2 绘图
在本文中,我们将看到如何在 R 编程语言中将多行文本注释到 ggplot2 Plot。
让我们首先创建一个规则图,以便差异明显,
例子:
R
# Load Package
library("ggplot2")

# Create a DataFrame
DF <- data.frame(X = runif(100, min=0, max=100),
                 Y = runif(100, min=0, max=100))

# Create a ScatterPlot using ggplot2.
ggplot(DF,aes(X, Y))+
  geom_point(size = 5, fill = "green", color = "black", shape = 21)
R
# Load ggplot2 Package
library("ggplot2")

# Create a DataFrame for Plotting
DF <- data.frame(X = runif(100, min=0, max=100),
                 Y = runif(100, min=0, max=100))

# ScatterPlot with Multiple Lines Text on it.
ggplot(DF,aes(X, Y))+
  geom_point(size = 5, fill = "green", color = "black", shape = 21)+
  annotate("text", x = 50, y = 10, label = "Geeks For Geeks\n(R Tutorial)",
           size = 10, color = "dark green")
输出:
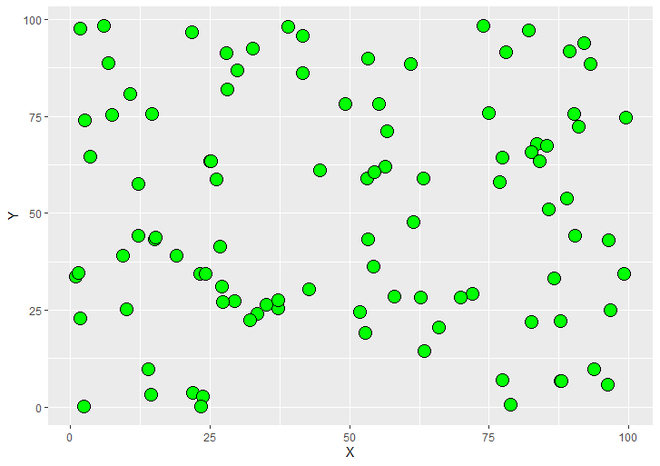
使用 ggplot2 的散点图
现在要为绘图注释多行, annotate()函数沿常规绘图使用。该函数传递了所需的值和属性。该方法类似于向图中添加一条线,唯一的区别是应该通过在要传递给图的文本中使用“\n”来创建每条新线。
Syntax : annotate(geom, x, y, label)
Parameters :
- geom : We assign geom that we want to add to the plot as a first parameter which will written in “” . geom can be anything like rect, segment, pointrange etc. here we will use text as a geom as we want to add text. all other arguments will be depends on geom that we select. So here all other parameters that we will use are only works for Annotating text to plot.
- x : Represents the Co-ordinates of X Axis.
- y : Represents the Co-ordinates of Y Axis.
- label : Text that we want to annotate on plot.
- Above threes parameters (i.e x, y and label) are necessary for annotating text but here we will also use two parameters size and color which are used to represent size and color of text respectively and they are not necessary to use.
Return : Geoms on plot.
例子:
电阻
# Load ggplot2 Package
library("ggplot2")

# Create a DataFrame for Plotting
DF <- data.frame(X = runif(100, min=0, max=100),
                 Y = runif(100, min=0, max=100))

# ScatterPlot with Multiple Lines Text on it.
ggplot(DF,aes(X, Y))+
  geom_point(size = 5, fill = "green", color = "black", shape = 21)+
  annotate("text", x = 50, y = 10, label = "Geeks For Geeks\n(R Tutorial)",
           size = 10, color = "dark green")
输出:
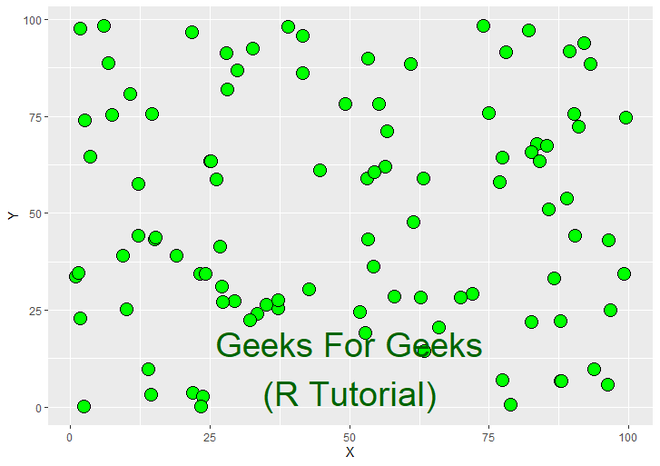
在绘图上注释多条线的散点图