如何将多行的ggplot2图例移动到R中的绘图底部
在本文中,我们将看到如何在 R 编程语言中绘制底部两行的 ggplot2 图例。首先,我们必须创建一个带有图例的简单数据图。在这里,我们将绘制一个简单的散点图。
加载库
首先,使用library()函数加载 ggplot2 包。
library("ggplot2")例如,创建一个 DataFrame。在这里,我们创建了一个简单的 DataFrame,其中包含三个名为Year 、 Points 、 和用户,然后将其分配给数据对象。
R
library("ggplot2")

# Create a DataFrame
data <- data.frame(Year = c(2011, 2012, 2013, 2014, 2015),
                   Points = c(30, 20, 15, 35, 50),
                   Users = c("user1", "user2", "user3",
                             "user4", "user5"))
print(data)
R
# Load Package
library("ggplot2")

# Create a DataFrame
data <- data.frame(Year = c(2011, 2012, 2013, 2014, 2015),
                   Points = c(30, 20, 15, 35, 50),
                   Users = c("user1", "user2", "user3",
                             "user4", "user5"))

# Create a Scatter Plot and assign it
# to gplot data object
gplot <- ggplot(data, aes(Year, Points, color = Users)) +
  geom_point(size = 7)
gplot
R
# Load Package
library(ggplot2)

# Create a DataFrame For plot
data <- data.frame(Year = c(2011, 2012, 2013, 2014, 2015),
                   Points = c(30, 20, 15, 35, 50),
                   Users = c("user1", "user2", "user3",
                             "user4", "user5"))

# Create a simple scatter plot
# with legend at bottom.
ggplot(data, aes(Year, Points, color = Users)) +
  geom_point(size = 7)+
  theme(legend.position = "bottom")
R
# Load Package
library(ggplot2)

# Create a DataFrame For plot
data <- data.frame(Year = c(2011, 2012, 2013, 2014, 2015),
                   Points = c(30, 20, 15, 35, 50),
                   Users = c("user1", "user2", "user3",
                             "user4", "user5"))

# Create a simple scatter plot with
# legend at bottom and with Two Rows.
# Specifies the Number of legend Rows
ggplot(data, aes(Year, Points, color = Users)) +
  geom_point(size = 7)+
  theme(legend.position = "bottom")+
  guides(color = guide_legend(nrow = 2))
输出:
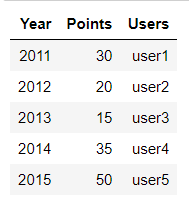
数据框
对于创建 R 图,我们使用ggplot()函数,为了使其成为散点图,我们将geom_point()函数添加到 ggplot()函数。将整个图分配给gplot数据对象。
代码:
电阻
# Load Package
library("ggplot2")

# Create a DataFrame
data <- data.frame(Year = c(2011, 2012, 2013, 2014, 2015),
                   Points = c(30, 20, 15, 35, 50),
                   Users = c("user1", "user2", "user3",
                             "user4", "user5"))

# Create a Scatter Plot and assign it
# to gplot data object
gplot <- ggplot(data, aes(Year, Points, color = Users)) +
  geom_point(size = 7)
gplot
输出:
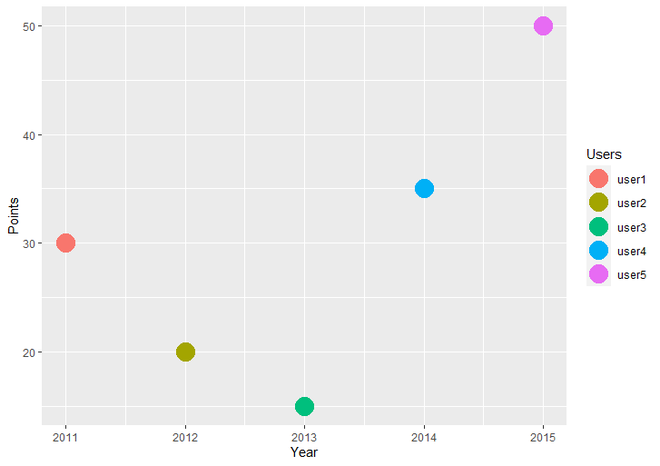
带有图例的简单散点图
在图的底部绘制 ggplot2 图例
要在图的底部绘制 ggplot2 图例,我们只需将 theme()函数添加到 geom_point()函数。
Syntax : theme(legend.position)
Parameter : In General, theme() function has many parameters to specify the theme of the plot but here we use only legend.position parameter which specify the position of Legend.
Return : Theme of the plot.
我们可以从left 、 right 、 top和bottom指定legend.position参数的值。为了在图形底部绘制图例,我们使用 'bottom' 作为 legend.position 参数的值。
电阻
# Load Package
library(ggplot2)

# Create a DataFrame For plot
data <- data.frame(Year = c(2011, 2012, 2013, 2014, 2015),
                   Points = c(30, 20, 15, 35, 50),
                   Users = c("user1", "user2", "user3",
                             "user4", "user5"))

# Create a simple scatter plot
# with legend at bottom.
ggplot(data, aes(Year, Points, color = Users)) +
  geom_point(size = 7)+
  theme(legend.position = "bottom")
输出:
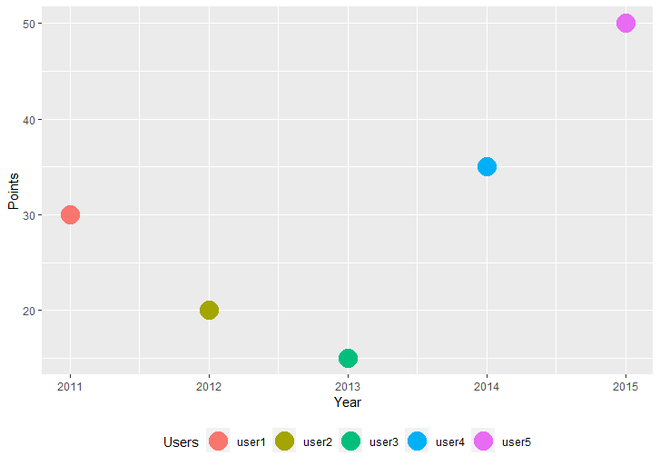
底部带有图例的散点图
用两行在底部绘制ggplot2图例
如果我们想用两行在图的底部绘制ggplot2 Legend,我们必须在theme()函数添加guides和guide_legend函数。在 guides()函数,我们采用名为color 的参数,该参数调用了 guide_legend() 指南函数作为值。在 guide_legend()函数,我们接受一个名为nrow的参数,它具有所需的图例行数作为值。
Syntax : guide_legend(nrow)
Parameter :
- nrow : The Desired Number of rows of legend.
Return : Legend Guides for various scales
代码:
电阻
# Load Package
library(ggplot2)

# Create a DataFrame For plot
data <- data.frame(Year = c(2011, 2012, 2013, 2014, 2015),
                   Points = c(30, 20, 15, 35, 50),
                   Users = c("user1", "user2", "user3",
                             "user4", "user5"))

# Create a simple scatter plot with
# legend at bottom and with Two Rows.
# Specifies the Number of legend Rows
ggplot(data, aes(Year, Points, color = Users)) +
  geom_point(size = 7)+
  theme(legend.position = "bottom")+
  guides(color = guide_legend(nrow = 2))
输出:
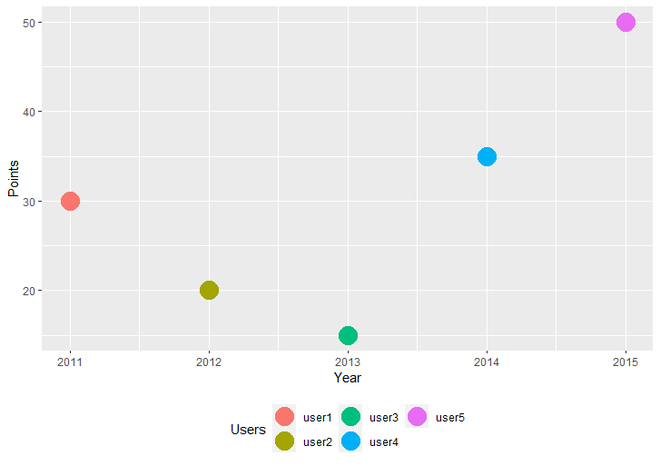
散点图,底部有两行图例