将轴标签移近以在 Base R 中绘图
在本文中,我们将讨论如何在 R 编程语言中将轴标签移近绘图。
在改变距离之前,让我们看看初始图会是什么样子。
例子:
R
x <- seq(-pi,pi,0.1)

plot(x, sin(x),
    main="The Sine Function",
    ylab="sin(x)",
    type="l",
    col="blue")
R
x <- seq(-pi,pi,0.1)

plot(x, sin(x),
    main="The Sine Function",
    ylab="",
    type="l",
    col="blue")

title(ylab="sin(x)", line=2, cex.lab=1.2)
R
x <- seq(-pi,pi,0.1)

plot(x, sin(x),
    main="The Sine Function",
    ylab="",
    type="l",
    col="blue")

title(ylab="sin(x)", mgp=c(2,1,0),cex.lab=1.2)
输出:
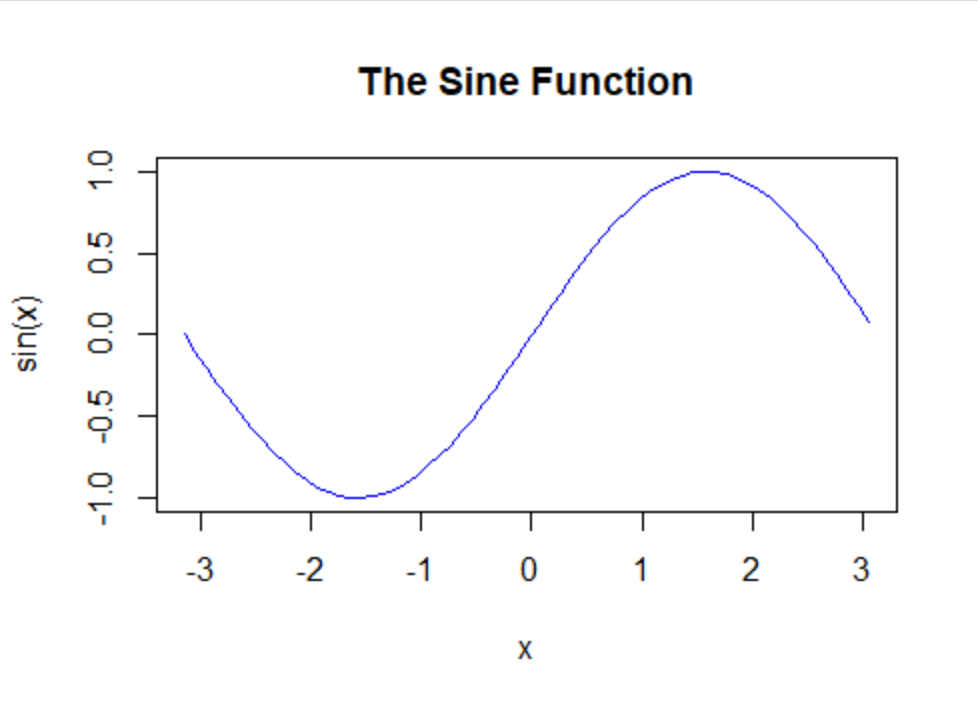
输出 1 - 查看 sin(x) 和 y 变量点之间的差距
方法 1:使用行参数
在上面的示例中,只需添加带有line参数的 title()函数。要将轴标签移近轴,将适当的值传递给 line 参数。
例子:
电阻
x <- seq(-pi,pi,0.1)

plot(x, sin(x),
    main="The Sine Function",
    ylab="",
    type="l",
    col="blue")

title(ylab="sin(x)", line=2, cex.lab=1.2)
输出:

现在检查差异!
方法 2:使用 mgp()
实现相同所需输出的第二种方法是调整mgp值。轴与轴名称之间的距离的默认值为 3。减小该值可减小它们之间的距离。
Syntax:
mgp(title, labels, line margin )
Parameters:
- title margin line for the axis title and its default value is 3.
- labels margin line for the axis labels and its default value is 1.
- Line margin value for the axis line and its default line is 0.
例子:
电阻
x <- seq(-pi,pi,0.1)

plot(x, sin(x),
    main="The Sine Function",
    ylab="",
    type="l",
    col="blue")

title(ylab="sin(x)", mgp=c(2,1,0),cex.lab=1.2)
输出:
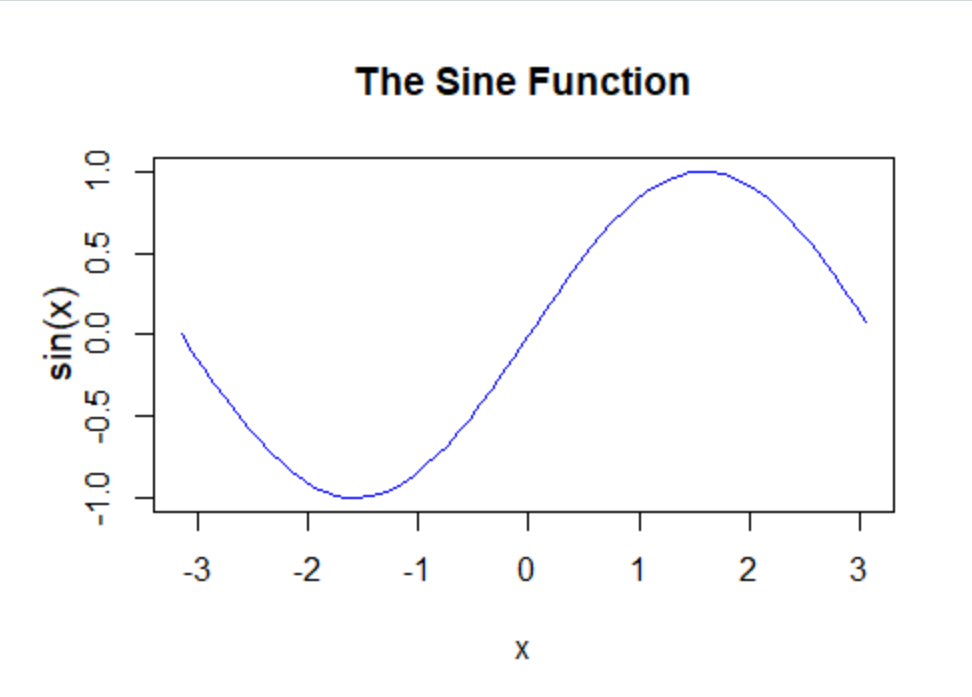
差异与 line=2 相同。