Mahotas – 标记区域的大小
在本文中,我们将了解如何在 mahotas 中获取标记区域的大小。标记图像是整数图像,其中值对应于不同区域。即,区域 1 是具有值 1 的所有像素,区域 2 是具有值 2 的像素,依此类推。按照惯例,区域 0 是背景,通常以不同方式处理。我们可以借助 mahotas.label 方法创建一个带标签的区域。
为此,我们将使用 mahotas.label_size 方法
Syntax : mahotas.labelled_size(labelled_region)
Argument : It takes numpy.ndarray object as argument i.e labelled region
Return : It returns list of integer
示例 1:
Python3
# importing required libraries
import mahotas as mh
import numpy as np
from pylab import imshow, show

# creating region
# numpy.ndarray
regions = np.zeros((10, 10), bool)

# setting 1 value in the region
regions[1, 1] = 1
regions[6, 6] = 1
regions[4, 4] = 1
regions[9, 9] = 1

# getting labelled function
labelled, nr_objects = mh.label(regions)

# showing the image with interpolation = 'nearest'
imshow(labelled, interpolation ='nearest')
show()

# getting sizes of labelled region
sizes = mh.labelled.labelled_size(labelled)

# printing sizes
for i in range(len(sizes)):

    print("Size of region " + str(i) + " : " + str(sizes[i]))
Python3
# importing required libraries
import mahotas as mh
import numpy as np
from pylab import imshow, show

# creating region
# numpy.ndarray
regions = np.zeros((10, 10), bool)

# setting 1 value to the region
regions[:3, :3] = 1
regions[6:, 6:] = 1

# getting labelled function
labelled, nr_objects = mh.label(regions)

# showing the image with interpolation = 'nearest'
imshow(labelled, interpolation ='nearest')
show()

# getting sizes of labelled region
sizes = mh.labelled.labelled_size(labelled)

# printing sizes
for i in range(len(sizes)):

    print("Size of region " + str(i) + " : " + str(sizes[i]))
输出 :

Size of region 0 : 96
Size of region 1 : 1
Size of region 2 : 1
Size of region 3 : 1
Size of region 4 : 1
示例 2:
Python3
# importing required libraries
import mahotas as mh
import numpy as np
from pylab import imshow, show

# creating region
# numpy.ndarray
regions = np.zeros((10, 10), bool)

# setting 1 value to the region
regions[:3, :3] = 1
regions[6:, 6:] = 1

# getting labelled function
labelled, nr_objects = mh.label(regions)

# showing the image with interpolation = 'nearest'
imshow(labelled, interpolation ='nearest')
show()

# getting sizes of labelled region
sizes = mh.labelled.labelled_size(labelled)

# printing sizes
for i in range(len(sizes)):

    print("Size of region " + str(i) + " : " + str(sizes[i]))
输出 :
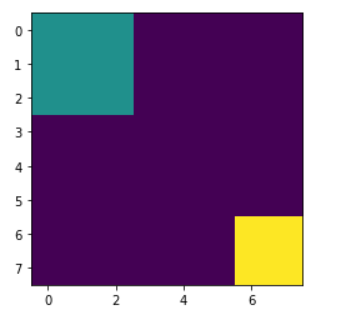
Size of region 0 : 75
Size of region 1 : 9
Size of region 2 : 16