PyQtGraph - 散点图
在本文中,我们将看到如何使用 PyQtGraph 模块创建散点图。 PyQtGraph 是一个图形和用户界面Python库,用于设计和科学应用程序中通常需要的功能。它提供了用于显示数据(绘图、视频等)的快速交互式图形。散点图使用点来表示两个不同数值变量的值。它是一种使用笛卡尔坐标显示一组数据的通常两个变量的值的图。每个点在水平和垂直轴上的位置表示单个数据点的值。散点图用于观察变量之间的关系。
我们可以在下面给出的命令的帮助下创建一个绘图窗口并在其上创建散点图
# creating a pyqtgraph plot window
plt = pg.plot()

# creating a scatter plot graphof size = 10
scatter = pg.ScatterPlotItem(size=10)
为了在pyqtgraph中创建散点图,需要遵循以下步骤:
- 导入pyqtgraph模块
- 导入其他模块以及 numpy 和 pyqt5
- 创建一个主窗口类
- 创建散点图项
- 使用 numpy 在随机位置创建随机点
- 将这些点添加到散点图数据中
- 创建网格布局
- 向布局添加散点图和附加标签
- 将布局小部件设置为中央小部件
例子:
Python3
# importing Qt widgets
from PyQt5.QtWidgets import *
# importing system
import sys
# importing numpy as np
import numpy as np
# importing pyqtgraph as pg
import pyqtgraph as pg
from PyQt5.QtGui import *
class Window(QMainWindow):
def __init__(self):
super().__init__()
# setting title
self.setWindowTitle("PyQtGraph")
# setting geometry
self.setGeometry(100, 100, 600, 500)
# icon
icon = QIcon("skin.png")
# setting icon to the window
self.setWindowIcon(icon)
# calling method
self.UiComponents()
# showing all the widgets
self.show()
# method for components
def UiComponents(self):
# creating a widget object
widget = QWidget()
# creating a label
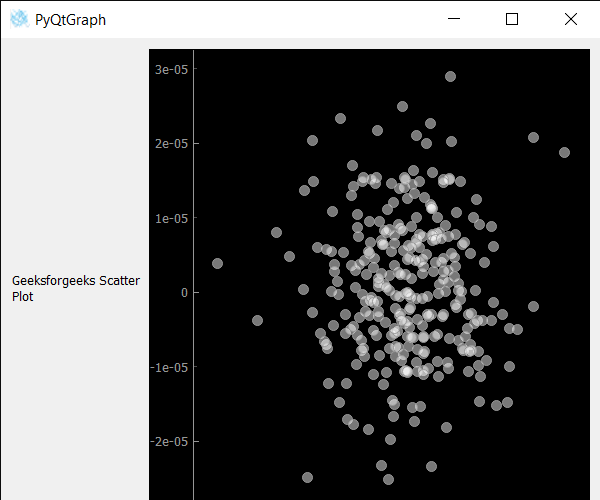
label = QLabel("Geeksforgeeks Scatter Plot")
# making label do word wrap
label.setWordWrap(True)
# creating a plot window
plot = pg.plot()
# number of points
n = 300
# creating a scatter plot item
# of size = 10
# using brush to enlarge the of white color with transparency is 50%
scatter = pg.ScatterPlotItem(
size=10, brush=pg.mkBrush(255, 255, 255, 120))
# getting random position
pos = np.random.normal(size=(2, n), scale=1e-5)
# creating spots using the random position
spots = [{'pos': pos[:, i], 'data': 1}
for i in range(n)] + [{'pos': [0, 0], 'data': 1}]
# adding points to the scatter plot
scatter.addPoints(spots)
# add item to plot window
# adding scatter plot item to the plot window
plot.addItem(scatter)
# Creating a grid layout
layout = QGridLayout()
# minimum width value of the label
label.setMinimumWidth(130)
# setting this layout to the widget
widget.setLayout(layout)
# adding label in the layout
layout.addWidget(label, 1, 0)
# plot window goes on right side, spanning 3 rows
layout.addWidget(plot, 0, 1, 3, 1)
# setting this widget as central widget of the main widow
self.setCentralWidget(widget)
# create pyqt5 app
App = QApplication(sys.argv)
# create the instance of our Window
window = Window()
# start the app
sys.exit(App.exec())输出 :