Python中的 Matplotlib.text.OffsetFrom 类
Matplotlib是Python中用于数组二维图的惊人可视化库。 Matplotlib 是一个基于 NumPy 数组构建的多平台数据可视化库,旨在与更广泛的 SciPy 堆栈配合使用。
matplotlib.text.OffsetFrom
matplotlib.text.OffsetFrom类是一个可调用的帮助类,用于使用 Annotation。
Syntax: class matplotlib.text.OffsetFrom(artist, ref_coord, unit=’points’)
Parameter:
- artist: This object is used to compute the offset. It is generally an Artist, a BboxBase or Transform.
- ref_coord: It is length 2 sequence. This values is the location to of the offset origin in fractions of the artist bounding box if it is an Artist or BboxBase whereas it is the offset origin is the transform applied to this value if artist is a Transform.
- unit : It is used to manage the screen units to use (pixels or points) for the offset input.
类的方法:
- get_unit(self) :它是 __call__ 使用的转换的输入单位。
- set_unit(self, unit):它是 __call__ 使用的变换的输入单位,其中,单位参数以“点”或“像素”为单位。
示例 1:
import matplotlib.pyplot as plt
import matplotlib.text

fig, ax = plt.subplots()

ax.plot([5,1], label="Label 1")
ax.plot([3,0], label="Label 2")

legend = ax.legend(loc="upper right")

# Create offset from lower right
# corner of legend box, (1.0,0) is
# the coordinates of the offset point
# in the legend coordinate system
offset = matplotlib.text.OffsetFrom(legend, (1.0, 0.0))

# Create annotation. Top right corner
# located -20 pixels below the offset
# point (lower right corner of legend).
ax.annotate("info_string",
            xy = (0,0),
            size = 14,
            xycoords = 'figure fraction',
            xytext = (0,-20),
            textcoords = offset,
            horizontalalignment = 'right',
            verticalalignment = 'top')

# Draw the canvas for offset to take effect
fig.canvas.draw()

plt.show()
输出: 
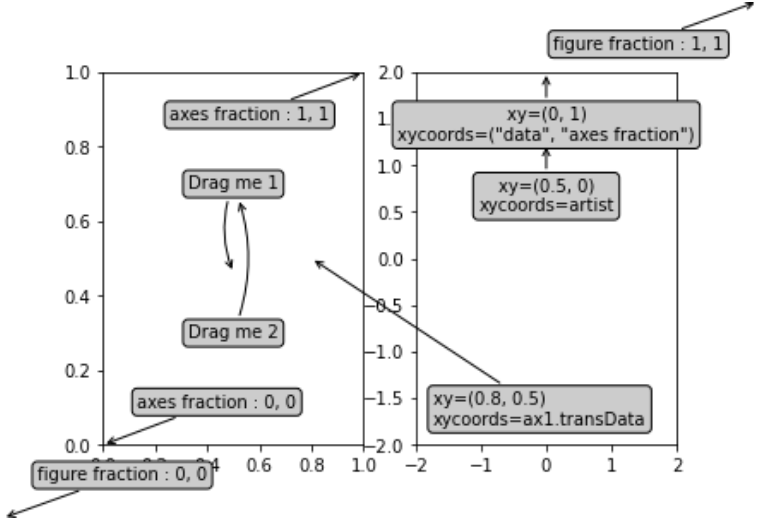
示例 2:
import matplotlib.pyplot as plt
from matplotlib.patches import Ellipse
import numpy as np
from matplotlib.text import OffsetFrom


fig, (ax1, ax2) = plt.subplots(1, 2)

bbox_args = dict(boxstyle ="round", fc ="0.8")
arrow_args = dict(arrowstyle ="->")

# Here we'll demonstrate the extents of the coordinate system and how
# we place annotating text.

ax1.annotate('figure fraction : 0, 0',
             xy =(0, 0),
             xycoords ='figure fraction',
             xytext =(20, 20),
             textcoords ='offset points',
             ha = "left",
             va = "bottom",
             bbox = bbox_args,
             arrowprops = arrow_args)

ax1.annotate('figure fraction : 1, 1',
             xy =(1, 1),
             xycoords ='figure fraction',
             xytext = (-20, -20),
             textcoords ='offset points',
             ha = "right",
             va = "top",
             bbox = bbox_args,
             arrowprops = arrow_args)

ax1.annotate('axes fraction : 0, 0',
             xy = (0, 0),
             xycoords ='axes fraction',
             xytext = (20, 20),
             textcoords ='offset points',
             ha = "left",
             va = "bottom",
             bbox = bbox_args,
             arrowprops = arrow_args)

ax1.annotate('axes fraction : 1, 1',
             xy =(1, 1),
             xycoords ='axes fraction',
             xytext = (-20, -20),
             textcoords ='offset points',
             ha = "right",
             va = "top",
             bbox = bbox_args,
             arrowprops = arrow_args)

# It is also possible to generate
# draggable annotations
an1 = ax1.annotate('Drag me 1', xy =(.5, .7),
                   xycoords ='data',
                   ha ="center", va ="center",
                   bbox = bbox_args,
                   )

an2 = ax1.annotate('Drag me 2', xy =(.5, .5),
                   xycoords = an1,
                   xytext =(.5, .3),
                   textcoords = 'axes fraction',
                   ha = "center",
                   va = "center",
                   bbox = bbox_args,
                   arrowprops = dict(patchB = an1.get_bbox_patch(),
                                   connectionstyle = "arc3, rad = 0.2",
                                   **arrow_args))
an1.draggable()
an2.draggable()

an3 = ax1.annotate('', xy =(.5, .5), xycoords = an2,
                   xytext =(.5, .5), textcoords = an1,
                   ha ="center", va ="center",
                   bbox = bbox_args,
                   arrowprops = dict(patchA = an1.get_bbox_patch(),
                                   patchB = an2.get_bbox_patch(),
                                   connectionstyle ="arc3, rad = 0.2",
                                   **arrow_args))

# Finally we'll show off some more
# complex annotation and placement
text = ax2.annotate('xy =(0, 1)\nxycoords = ("data", "axes fraction")',
                    xy =(0, 1),
                    xycoords = ("data", 'axes fraction'),
                    xytext = (0, -20),
                    textcoords ='offset points',
                    ha = "center",
                    va = "top",
                    bbox = bbox_args,
                    arrowprops = arrow_args)

ax2.annotate('xy =(0.5, 0)\nxycoords = artist',
             xy =(0.5, 0.),
             xycoords = text,
             xytext = (0, -20),
             textcoords = 'offset points',
             ha = "center",
             va = "top",
             bbox = bbox_args,
             arrowprops = arrow_args)

ax2.annotate('xy =(0.8, 0.5)\nxycoords = ax1.transData',
             xy =(0.8, 0.5),
             xycoords = ax1.transData,
             xytext = (10, 10),
             textcoords = OffsetFrom(ax2.bbox, (0, 0), "points"),
             ha = "left",
             va = "bottom",
             bbox = bbox_args,
             arrowprops = arrow_args)

ax2.set(xlim =[-2, 2], ylim =[-2, 2])
plt.show()
输出: 