在 R 中的同一图中绘制多个图形和线条
当多个图形和线图组合成一个图形时,可视化有时会更有意义。在本文中,我们将讨论如何在 R 编程语言中执行相同的操作。
方法 1:使用基础 R
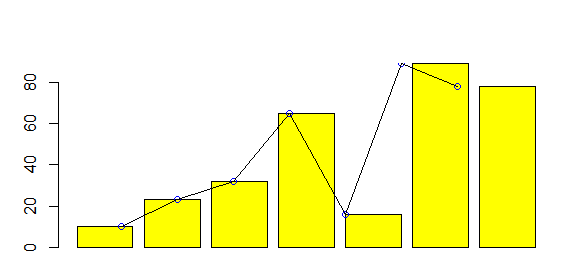
Base R 支持某些可用于生成所需绘图的方法。在此示例图中,相同数据的散点图、线图和条形图位于同一框架中。
barplot()函数用于生成具有适当参数的条形图。
Syntax:
barplot(H, xlab, ylab, main, names.arg, col)
Parameters:
- H: This parameter is a vector or matrix containing numeric values which are used in bar chart.
- xlab: This parameter is the label for x axis in bar chart.
- ylab: This parameter is the label for y axis in bar chart.
- main: This parameter is the title of the bar chart.
- names.arg: This parameter is a vector of names appearing under each bar in bar chart.
- col: This parameter is used to give colors to the bars in the graph.
R 语言中的points()函数用于将一组具有指定形状、大小和颜色的点添加到现有绘图中。
Syntax: points(x, y, cex, pch, col)
Parameters:
x, y: Vector of coordinates
cex: size of points
pch: shape of points
col: color of points
R 语言中的lines()函数用于向现有绘图添加不同类型、颜色和宽度的线条。
Syntax: lines(x, y, col, lwd, lty)
Parameters:
x, y: Vector of coordinates
col: Color of line
lwd: Width of line
lty: Type of line
这个想法简单明了。添加不同可视化的方法只需要一一添加到代码中,绘图将解释每个函数并相应地绘制绘图。
例子:
R
df<-data.frame(x = c("A","B","C","D","E","F","G"),
               y = c(10,23,32,65,16,89,78))

barplot(df$y, xlab = df$x, col = "yellow")
points(df$x, df$y, type = "o",col = "blue")
lines(df$x, df$y)
R
library(ggplot2)

df<-data.frame(x = c("A","B","C","D","E","F","G"),
               y = c(10,23,32,65,16,89,78),)

ggplot(df, aes(x, y, group = 1))+
geom_bar(stat = "identity")+
geom_line(color = "green")+
geom_point(color = "blue")
输出:

方法二:使用ggplot
ggplot 是 R 支持的一个库,可视化更容易。这再次可用于将多个图形合并为一个。使用 ggplot()函数对绘图进行概括,然后使用 + 符号将所有绘图添加到同一绘图中。
在这里,geom_bar() 用于绘制条形图,geom_line() 用于绘制折线图,geom_point() 用于散点图。
例子:
电阻
library(ggplot2)

df<-data.frame(x = c("A","B","C","D","E","F","G"),
               y = c(10,23,32,65,16,89,78),)

ggplot(df, aes(x, y, group = 1))+
geom_bar(stat = "identity")+
geom_line(color = "green")+
geom_point(color = "blue")
输出:
