Python中的 PyQtGraph 模块介绍
PyQtGraph是一个用于Python的图形和用户界面库,它提供了设计和科学应用程序中通常需要的功能。它的主要目标是提供用于显示数据(绘图、视频等)的快速交互式图形,其次是提供有助于快速应用程序开发的工具(例如,Qt Designer 中使用的属性树)。
PyQtGraph 大量使用 Qt GUI 平台(通过 PyQt 或 PySide)获得高性能图形,使用 numpy 进行大量数字运算。特别是,pyqtgraph 使用 Qt 的 GraphicsView 框架,该框架本身是一个功能强大的图形系统,这为该框架带来了优化和简化的原语,以最小的努力实现数据可视化。
为了安装 PyQtGraph,我们使用下面给出的命令
pip install pyqtgraph要求: PyQtGraph 可以在任何支持以下包的平台上运行:
1. Python 2.7 和 3+
2. PyQt 4.8+ 或 PySide
3. NumPy
4. 3D图形需要python-opengl绑定
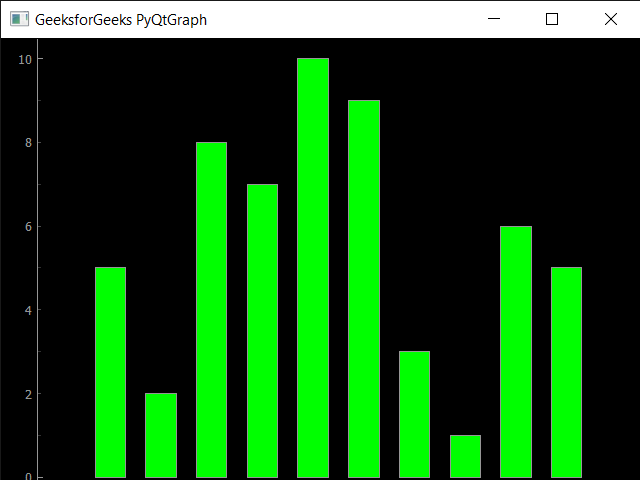
示例:在此示例中,我们将使用Python中的 PyQtGraph 模块创建一个简单的条形图
Python3
# importing pyqtgraph as pg
import pyqtgraph as pg

# importing QtCore and QtGui from the pyqtgraph module
from pyqtgraph.Qt import QtCore, QtGui

# importing numpy as np
import numpy as np

# creating a pyqtgraph plot window
window = pg.plot()

# title
title = "GeeksforGeeks PyQtGraph"

# setting window title
window.setWindowTitle(title)

# create list for y-axis
y1 = [5, 5, 7, 10, 3, 8, 9, 1, 6, 2]

# create horizontal list i.e x-axis
x = [1, 10, 4, 5, 7, 3, 6, 8, 9, 2]

# create pyqt5graph bar graph item
# with bar colors = green
bargraph1 = pg.BarGraphItem(x = x, height = y1, width = 0.6, brush ='g')

# adding bargraph item to the window
window.addItem(bargraph1)

# main method
if __name__ == '__main__':

    # importing system
    import sys

    # Start Qt event loop unless running in interactive mode or using
    if (sys.flags.interactive != 1) or not hasattr(QtCore, 'PYQT_VERSION'):
        QtGui.QApplication.instance().exec_()
Python3
# importing pyqtgraph as pg
import pyqtgraph as pg

# importing QtCore and QtGui from the pyqtgraph module
from pyqtgraph.Qt import QtCore, QtGui

# importing numpy as np
import numpy as np

# define the data
title = "GeeksforGeeks PyQtGraph"

# y values to plot by line 1
y = [2, 8, 6, 8, 6, 11, 14, 13, 18, 19]

# y values to plot by line 2
y2 = [3, 1, 5, 8, 9, 11, 16, 17, 14, 16]
x = range(0, 10)

# create plot object
plt = pg.plot()

# showing x and y grids
plt.showGrid(x = True, y = True)

# adding legend
plt.addLegend()

# set properties of the label for y axis
plt.setLabel('left', 'Vertical Values', units ='y')

# set properties of the label for x axis
plt.setLabel('bottom', 'Horizontal Values', units ='s')

# setting horizontal range
plt.setXRange(0, 10)

# setting vertical range
plt.setYRange(0, 20)

# setting window title
plt.setWindowTitle(title)

# ploting line in green color
line1 = plt.plot(x, y, pen ='g', symbol ='x', symbolPen ='g', symbolBrush = 0.2, name ='green')

# ploting line2 with blue color
line2 = plt.plot(x, y2, pen ='b', symbol ='o', symbolPen ='b', symbolBrush = 0.2, name ='blue')


# main method
if __name__ == '__main__':

    # importing system
    import sys

    # Start Qt event loop unless running in interactive mode or using
    if (sys.flags.interactive != 1) or not hasattr(QtCore, 'PYQT_VERSION'):
        QtGui.QApplication.instance().exec_()
输出 :
示例:在这里,我们将在同一张图中绘制两条线,下面是实现
蟒蛇3
# importing pyqtgraph as pg
import pyqtgraph as pg

# importing QtCore and QtGui from the pyqtgraph module
from pyqtgraph.Qt import QtCore, QtGui

# importing numpy as np
import numpy as np

# define the data
title = "GeeksforGeeks PyQtGraph"

# y values to plot by line 1
y = [2, 8, 6, 8, 6, 11, 14, 13, 18, 19]

# y values to plot by line 2
y2 = [3, 1, 5, 8, 9, 11, 16, 17, 14, 16]
x = range(0, 10)

# create plot object
plt = pg.plot()

# showing x and y grids
plt.showGrid(x = True, y = True)

# adding legend
plt.addLegend()

# set properties of the label for y axis
plt.setLabel('left', 'Vertical Values', units ='y')

# set properties of the label for x axis
plt.setLabel('bottom', 'Horizontal Values', units ='s')

# setting horizontal range
plt.setXRange(0, 10)

# setting vertical range
plt.setYRange(0, 20)

# setting window title
plt.setWindowTitle(title)

# ploting line in green color
line1 = plt.plot(x, y, pen ='g', symbol ='x', symbolPen ='g', symbolBrush = 0.2, name ='green')

# ploting line2 with blue color
line2 = plt.plot(x, y2, pen ='b', symbol ='o', symbolPen ='b', symbolBrush = 0.2, name ='blue')


# main method
if __name__ == '__main__':

    # importing system
    import sys

    # Start Qt event loop unless running in interactive mode or using
    if (sys.flags.interactive != 1) or not hasattr(QtCore, 'PYQT_VERSION'):
        QtGui.QApplication.instance().exec_()
输出 :

PyQtGraph 可以执行的操作:
1. 基本的数据可视化,如图像、线和散点图
2. 足够快来绘制视频/数据的实时更新
3. 交互式缩放/平移、平均、FFT、SVG/PNG 导出
4. 用于标记和选择绘图区域的小部件
5、多维图像数据自动切片
6. 构建自定义图像感兴趣区域小部件的框架
7. 对接系统替代/补充 Qt 的对接系统,以允许更复杂(和更可预测)的对接安排
8. ParameterTree 小部件,用于动态界面的快速原型设计