PyQtGraph - 设置误差条形图的数据
在本文中,我们将看到如何在 PyQtGraph 模块中设置误差条形图的数据。 PyQtGraph 是一个用于Python的图形和用户界面库,它提供了设计和科学应用程序中通常需要的功能。它的主要目标是提供用于显示数据(绘图、视频等)的快速交互式图形。误差条是数据可变性的图形表示,并在图表上用于指示报告测量中的误差或不确定性。它们给出了测量精确度的一般概念,或者相反,真实值可能与报告值相差多远。误差条形图的数据基本上是 x 轴和 y 轴值以及这些值的上下限,即误差估计。
我们可以在下面给出的命令的帮助下创建一个绘图窗口并在其上创建一个误差条形图。
# creating a pyqtgraph plot window
plt = pg.plot()

# creating a error bar item object
error = pg.ErrorBarItem(x=x, y=y, top=top,
                  bottom=bottom, beam=0.5)
In order to do this we use setData method with the error bar item object
Syntax : error.setData(x=x, y=y, top=top, bottom=bottom)
Argument : It takes four numpy arrays as argument
Return : It returns None
下面是实现。
Python3
# importing Qt widgets
from PyQt5.QtWidgets import *
# importing system
import sys
# importing numpy as np
import numpy as np
# importing pyqtgraph as pg
import pyqtgraph as pg
from PyQt5.QtGui import *
from PyQt5.QtCore import *
from collections import namedtuple
class Window(QMainWindow):
def __init__(self):
super().__init__()
# setting title
self.setWindowTitle("PyQtGraph")
# setting geometry
self.setGeometry(100, 100, 600, 500)
# icon
icon = QIcon("skin.png")
# setting icon to the window
self.setWindowIcon(icon)
# calling method
self.UiComponents()
# showing all the widgets
self.show()
# method for components
def UiComponents(self):
# creating a widget object
widget = QWidget()
# creating a label
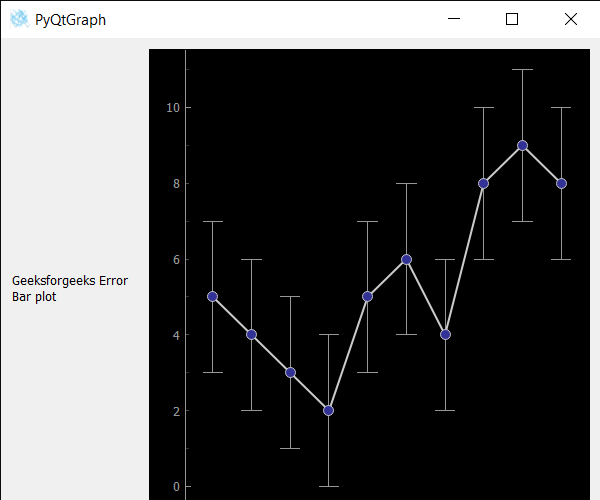
label = QLabel("Geeksforgeeks Error Bar plot")
# making label do word wrap
label.setWordWrap(True)
# setting configuration options
pg.setConfigOptions(antialias=True)
# creating x-axis values
x = np.array([1, 2, 3, 4, 5, 6, 7, 8, 9, 10])
# creating y-axis values
y = np.array([5, 4, 3, 2, 5, 6, 4, 8, 9, 8])
# creating upper bound values
top = np.array([2, 2, 2, 2, 2, 2, 2, 2, 2, 2])
# creating lower bound values
bottom = np.array([2, 2, 2, 2, 2, 2, 2, 2, 2, 2])
# creating a plot window
plt = pg.plot()
# creating a error bar item
error = pg.ErrorBarItem(beam=0.5)
# setting data to error bar item
error.setData(x=x, y=y, top=top, bottom=bottom)
# adding error bar item to the plot window
plt.addItem(error)
# plotting the data on plot window
plt.plot(x, y, symbol='o', pen={'color': 0.8, 'width': 2})
# Creating a grid layout
layout = QGridLayout()
# minimum width value of the label
label.setMinimumWidth(130)
# setting this layout to the widget
widget.setLayout(layout)
# adding label in the layout
layout.addWidget(label, 1, 0)
# plot window goes on right side, spanning 3 rows
layout.addWidget(plt, 0, 1, 3, 1)
# setting this widget as central widget of the main widow
self.setCentralWidget(widget)
# create pyqt5 app
App = QApplication(sys.argv)
# create the instance of our Window
window = Window()
# start the app
sys.exit(App.exec())输出: