在 R 中写入 CSV 文件
对于数据分析,有时需要创建 CSV 数据文件,并根据我们的要求对其进行一些操作。因此,在本文中,我们将学习如何使用 R 编程语言将数据写入 CSV 文件。
使用 write.csv()函数写入 csv 文件。
Syntax: write.csv(data, path)
Parameter:
- data: data to be added to csv
- path: pathname of the file
方法:
- 创建数据帧
- 将所需的值传递给函数
- 写入文件
让我们首先创建一个数据框。
例子:
R
Country <- c("China", "India", "United States", "Indonesia", "Pakistan")

Population_1_july_2018 <- c("1,427,647,786", "1,352,642,280",
                            "327,096,265", "267,670,543", "212,228,286")

Population_1_july_2019 <- c("1,433,783,686", "1,366,417,754",
                            "329,064,917", "270,625,568", "216,565,318")

change_in_percents <- c("+0.43%", "+1.02%", "+0.60%", "+1.10%", "+2.04%")


data <- data.frame(Country, Population_1_july_2018, Population_1_july_2019, change_in_percents)
print(data)
R
Country <- c("China", "India", "United States", "Indonesia", "Pakistan")

Population_1_july_2018 <- c("1,427,647,786", "1,352,642,280",
                            "327,096,265", "267,670,543", "212,228,286")

Population_1_july_2019 <- c("1,433,783,686", "1,366,417,754",
                            "329,064,917", "270,625,568", "216,565,318")

change_in_percents <- c("+0.43%", "+1.02%", "+0.60%", "+1.10%", "+2.04%")


data <- data.frame(Country, Population_1_july_2018, Population_1_july_2019, change_in_percents)
print(data)

write.csv(data,"C:\\Users\\...YOUR PATH...\\population.csv")
print ('CSV file written Successfully :)')
输出:

我们在控制台中的数据
现在让我们将此数据写入 csv 文件并将其保存到所需位置。
例子:
电阻
Country <- c("China", "India", "United States", "Indonesia", "Pakistan")

Population_1_july_2018 <- c("1,427,647,786", "1,352,642,280",
                            "327,096,265", "267,670,543", "212,228,286")

Population_1_july_2019 <- c("1,433,783,686", "1,366,417,754",
                            "329,064,917", "270,625,568", "216,565,318")

change_in_percents <- c("+0.43%", "+1.02%", "+0.60%", "+1.10%", "+2.04%")


data <- data.frame(Country, Population_1_july_2018, Population_1_july_2019, change_in_percents)
print(data)

write.csv(data,"C:\\Users\\...YOUR PATH...\\population.csv")
print ('CSV file written Successfully :)')
输出:

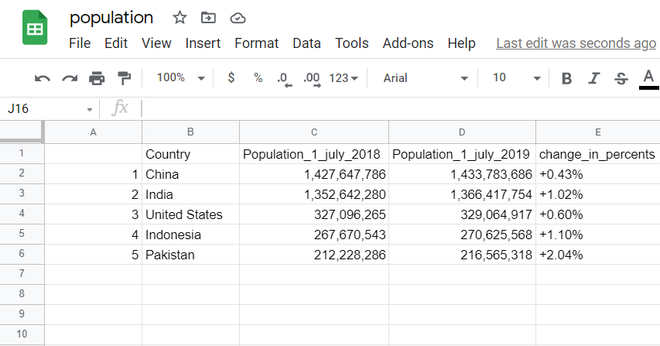
包含数据的 CSV 文件