Python中的 Pandas 分析
Python中的 pandas_profiling 库包含一个名为 ProfileReport() 的方法,该方法在输入 DataFrame 上生成基本报告。
该报告包括以下内容:
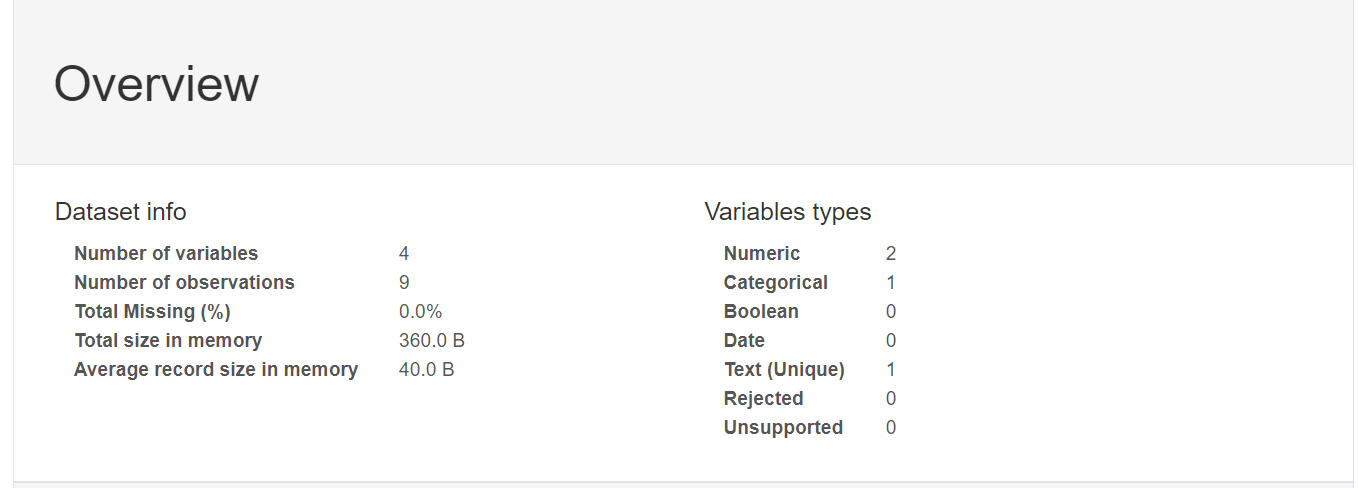
- 数据框概述,
- 定义 DataFrame 的每个属性,
- 属性之间的相关性(Pearson 相关性和 Spearman 相关性),以及
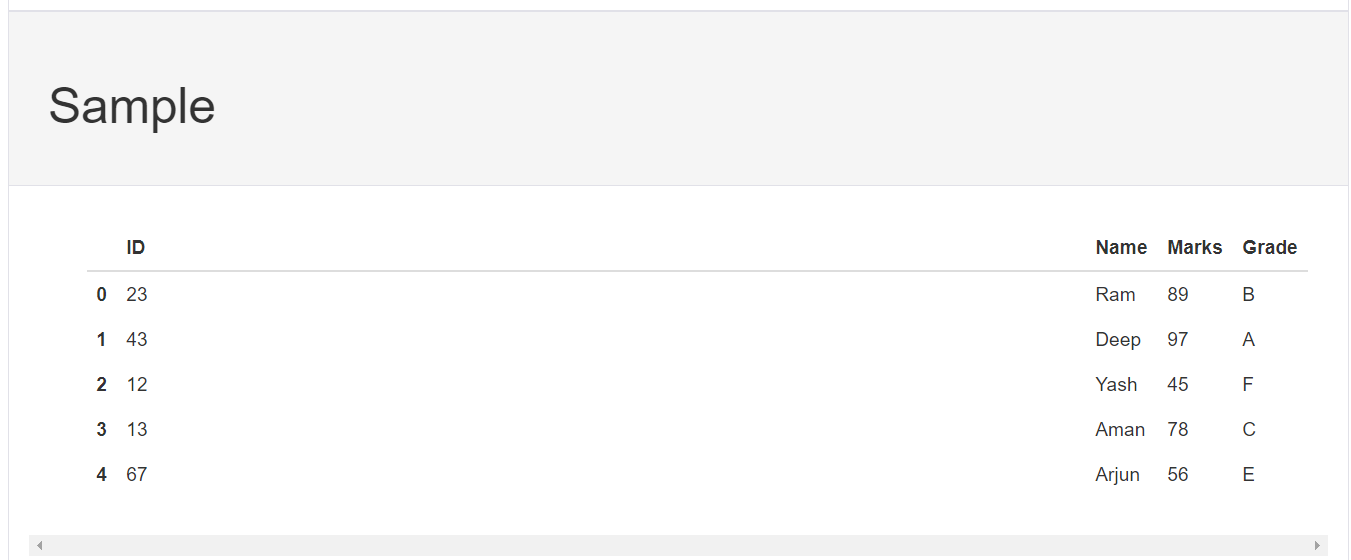
- DataFrame 示例。
句法 :
pandas_profiling.ProfileReport(df, **kwargs)| Arguments | Type | Description |
|---|---|---|
| df | DataFrame | Data to be analyzed |
| bins | int | Number of bins in histogram. The default is 10. |
| check_correlation | boolean | Whether or not to check correlation. It’s `True` by default. |
| correlation_threshold | float | Threshold to determine if the variable pair is correlated. The default is 0.9. |
| correlation_overrides | list | Variable names not to be rejected because they are correlated. There is no variable in the list (`None`) by default. |
| check_recoded | boolean | Whether or not to check recoded correlation (memory heavy feature). Since it’s an expensive computation it can be activated for small datasets. `check_correlation` must be true to disable this check. It’s `False` by default. |
| pool_size | int | Number of workers in thread pool. The default is equal to the number of CPU. |
例子:
Python3
# importing packages
import pandas as pd
import pandas_profiling as pp


# dictionary of data
dct = {'ID': {0: 23, 1: 43, 2: 12, 3: 13,
              4: 67, 5: 89, 6: 90, 7: 56,
              8: 34},
       'Name': {0: 'Ram', 1: 'Deep', 2: 'Yash',
                3: 'Aman', 4: 'Arjun', 5: 'Aditya',
                6: 'Divya', 7: 'Chalsea',
                8: 'Akash' },
       'Marks': {0: 89, 1: 97, 2: 45, 3: 78,
                 4: 56, 5: 76, 6: 100, 7: 87,
                 8: 81},
       'Grade': {0: 'B', 1: 'A', 2: 'F', 3: 'C',
                 4: 'E', 5: 'C', 6: 'A', 7: 'B',
                 8: 'B'}
      }

# forming dataframe and printing
data = pd.DataFrame(dct)
print(data)

# forming ProfileReport and save
# as output.html file
profile = pp.ProfileReport(data)
profile.to_file("output.html")
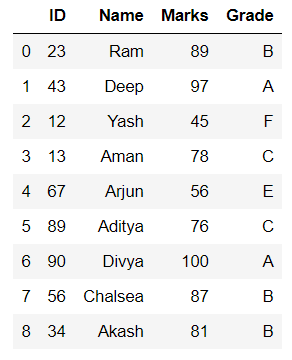
输出:

数据框
名为 output.html 的 html 文件如下:


