在R中按组汇总data.table的多列
在本文中,我们将讨论如何在 R 编程语言中按 Group 汇总 data.table 的多列。
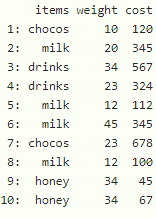
创建用于演示的表:
R
# load data.table package
library("data.table")

# create data table with 3 columns
# items
# weight and #cost
data <- data.table( items= c("chocos","milk","drinks","drinks",
                             "milk","milk","chocos","milk",
                             "honey","honey"),

                   weight= c(10,20,34,23,12,45,23,
                             12,34,34),

                   cost=  c(120,345,567,324,112,345,
                            678,100,45,67))

# display
data
R
# load data.table package
library("data.table")

# create data table with 3 columns
# items
# weight and #cost
data <- data.table( items= c("chocos","milk","drinks","drinks",
                             "milk","milk","chocos","milk",
                             "honey","honey"),

                   weight= c(10,20,34,23,12,45,23,
                             12,34,34),

                   cost=  c(120,345,567,324,112,345,
                            678,100,45,67))


# group by sum with items column
print(data[, lapply(.SD, sum), by = items])

# group by average with items column
print(data[, lapply(.SD, mean), by = items])
R
# load data.table package
library("data.table")

# create data table with 3 columns
# items weight and #cost
data <- data.table( items= c("chocos","milk","drinks","drinks",
                             "milk","milk","chocos","milk",
                             "honey","honey"),

                   weight= c(10,20,34,23,12,45,23,
                             12,34,34),

                   cost=  c(120,345,567,324,112,345,
                            678,100,45,67))

# group by minimum  with items column
print(data[, lapply(.SD, min), by = items])

# group by maximum with items column
print(data[, lapply(.SD, max), by = items])
输出:

我们可以通过 4 种方式总结多列:
- 通过寻找平均值
- 通过求和
- 通过找到最小值
- 通过找到最大值
我们可以通过使用 lapply()函数来做到这一点
Syntax: datatable[, lapply(.SD, summarizing_function), by = column]
where
- datatable is the input data table
- lpply() is used to hold two parameters
- first parameter is .SD is standard R object
- second parameter is an summarizing function that takes summarizing functions to summarize the datatable
- by is the name of the column in which data is grouped based on this column
例1:R程序通过求和和平均值汇总数据表
电阻
# load data.table package
library("data.table")

# create data table with 3 columns
# items
# weight and #cost
data <- data.table( items= c("chocos","milk","drinks","drinks",
                             "milk","milk","chocos","milk",
                             "honey","honey"),

                   weight= c(10,20,34,23,12,45,23,
                             12,34,34),

                   cost=  c(120,345,567,324,112,345,
                            678,100,45,67))


# group by sum with items column
print(data[, lapply(.SD, sum), by = items])

# group by average with items column
print(data[, lapply(.SD, mean), by = items])
输出:

示例2:R程序按最小值和最大值汇总数据表
电阻
# load data.table package
library("data.table")

# create data table with 3 columns
# items weight and #cost
data <- data.table( items= c("chocos","milk","drinks","drinks",
                             "milk","milk","chocos","milk",
                             "honey","honey"),

                   weight= c(10,20,34,23,12,45,23,
                             12,34,34),

                   cost=  c(120,345,567,324,112,345,
                            678,100,45,67))

# group by minimum  with items column
print(data[, lapply(.SD, min), by = items])

# group by maximum with items column
print(data[, lapply(.SD, max), by = items])
输出:
