使用 scipy.signal.gausspulse 创建高斯脉冲
先决条件:Scipy
高斯滤波器的脉冲响应写为高斯函数如下:

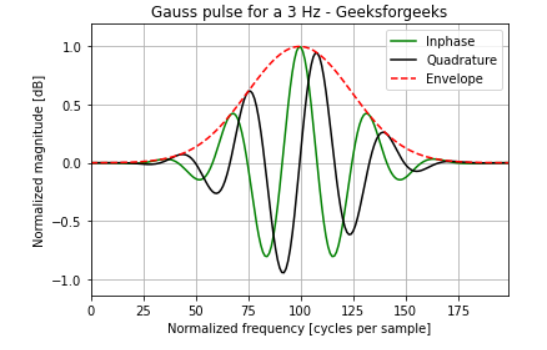
它的结果也是高斯的。在本文中,我们将使用 scipy 和 matplotlib Python库绘制 3Hz 的高斯脉冲。高斯脉冲用于运动分析的数字滤波器。使用 scipy 的 gausspulse() 方法创建高斯脉冲。 gausspulse() 在阵列 t 中指示的时间返回单位幅度的高斯调制正弦脉冲,中心频率“fc”以赫兹 (Hz) 为单位。
Syntax: scipy.signal.gausspulse(t, fc retquad, retenv)
Parameter:
- t: Input array.
- fc: Center frequency.
- retquad: If True, return the imaginary as well as the real part of the signal. Default is False.
- retenv: If True, return the envelope of the signal. Default is False.
Returns
- yI: The real part of the signal. Always returned.
- yQ: Imaginary part of signal. Only returned if retquad is True.
- yenv: The envelope of the signal. Only returned if retenv is True.
方法:
- 导入所需的模块。
- 使用 np.linespace 创建一个数据数组。
- 创建一个 3 Hz 的高斯脉冲。
- 标记图形。
- 显示结果图。
使用上述方法的实现如下图所示:
Python3
from scipy import signal
import matplotlib.pyplot as plt
import numpy as np

t = np.linspace(-1, 1, 200)

i, q, e = signal.gausspulse(t, fc=3, retquad=True, retenv=True)

plt.plot(i, color='green')
plt.plot(q, color='black')
plt.plot(e, '--', color='red')

plt.title('Gauss pulse for a 3 Hz - Geeksforgeeks')
plt.ylabel("Normalized magnitude [dB]")
plt.xlabel("Normalized frequency [cycles per sample]")
plt.margins(0, 0.1)
plt.grid(which='both', axis='both')
plt.legend(['Inphase', 'Quadrature', 'Envelope'])

plt.show()
输出:
