📌 相关文章
- 使用Tikz的 latex 节点图(1)
- 使用Tikz的 latex 节点图
- 使用Tikz的 latex 条形图和饼图
- 使用Tikz的方程的 latex 图(1)
- 使用Tikz的方程的 latex 图
- 使用Tikz的 latex 框图
- 使用Tikz的 latex 框图(1)
- 流程图
- 流程图(1)
- 流程图元素
- 流程图元素(1)
- 算法流程图(1)
- 算法流程图
- 流程图简介(1)
- 流程图简介
- 程序和流程图的区别(1)
- 程序和流程图的区别
- 流程图与数据流程图(DFD)之间的区别(1)
- 流程图与数据流程图(DFD)之间的区别
- 流程图设计器 (1)
- 在线流程图 (1)
- 如何使用Latex
- 如何使用Latex(1)
- 算法与流程图的区别
- 算法与流程图的区别(1)
- latex表
- latex 图
- latex 图
- c# latex - C# (1)
📜 使用Tikz的 latex 流程图
📅 最后修改于: 2021-01-06 00:50:47 🧑 作者: Mango
使用Tikz的 latex 流程图
流程图是概述算法的方法。它被广泛用于有效地表示信息。它是执行特定过程所需的步骤和决策的直观表示。
可以快速查看该过程,并且可以从头到尾遵循这些步骤。图或图表中使用的不同形状称为流程图符号。
同样,在 latex 中,您可以使用某些命令在任何地方插入任何流程图或图表。
让我们通过一个例子来理解它。这里的主题将为您提供创建流程图的想法。您可以为图表创建类型和样式。
第一个图将为您提供简单流程图的基本概念,而第二个示例将为复杂流程图。
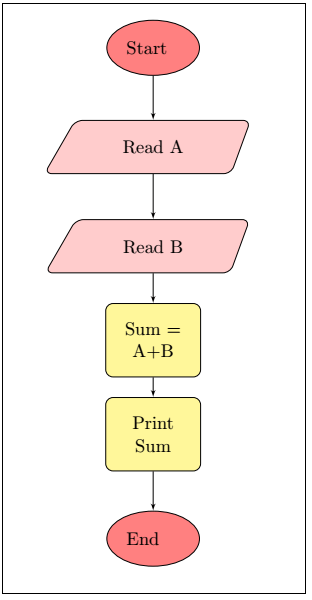
1.第一个示例的代码如下:
\documentclass{article}

\usepackage{tikz} % the tikz package
\usetikzlibrary{shapes.geometric,arrows} % to implement the corresponding shapes and arrows, these are used.
\begin{document}

% the commands given below are used to define the styles for particular blocks. You can modify the dimensions, texture, etc. according to the requirements.

\tikzstyle{block} = [rectangle, draw, fill=yellow!50,
    text width=4.5em, text centered, rounded corners, minimum height=4em] % the width signifies the width of the box. You can change the width accordingly, while the height will be adjusted according to the text.
    % it signifies that for the Block section, the Rectangle shape will be used. The color or shape can be modified.
    % here, distance is the distance between the corresponding block
\tikzstyle{line} = [draw, -latex']
\tikzstyle{cloud} = [draw, ellipse,text width= 2.9em, fill=red!50, node distance=2cm, minimum height=3em]
% the greater the value of the larger, the darker the color.
% the shapes that are determined above with the width, and the color will only be used further. The shapes not declared here, will not be recognized by the Latex.
 \tikzstyle{io} = [trapezium, draw, trapezium right angle=110, rounded corners, fill=red!20, node distance=1.9cm, minimum height=2.9em]
 % the draw command here is used to draw the boundary of mentioned shape.
% you can add more parameters to the tikzstyle according to the requirements.
\begin{tikzpicture}[node distance = 1.8cm, auto] % the command node distance is important as it determines the space or the length of the arrow between different blocks.
    % the command given below are the place of nodes
    \node [cloud] (init) {Start};
    \node [io, below of= init](ReadA){Read A};
    \node [io, below of= ReadA](ReadB){Read B};
    \node [block, below of = ReadB](Sum){Sum = A+B};
    \node [block, below of = Sum](P){Print Sum};
    \node [cloud, below of = P](Out){End};
    \path [line] (init) -- (ReadA);
    \path [line] (ReadA) -- (ReadB);
    \path [line] (ReadB) -- (Sum);
    \path [line] (Sum) -- (P);
    \path [line] (P) -- (Out);

\end{tikzpicture}
\end{document}
输出:

2.下面是第二个示例的代码:
\documentclass{article}

\usepackage{tikz} % the tikz package
\usetikzlibrary{shapes.geometric, arrows}
\begin{document}

\tikzstyle{decision} = [diamond, draw, fill=orange!80,
    text width=5.0em, text centered, node distance=3.1cm,]
    \tikzstyle{document} = [rectangle, draw, fill=blue!30,
    text width=4.7em, text centered, node distance=2.5cm,]
   \tikzstyle{block1} = [rectangle, draw, fill=green!50,  %here, we have chosen another block for the different color
    text width=4.5em, text centered, rounded corners, node distance= 3cm, minimum height=3em] % you can create as many different shapes to make your diagram more creative and attractive, depending on the requirements
\tikzstyle{block} = [rectangle, draw, fill=yellow!50,
    text width=4.5em, text centered, rounded corners, node distance=2.25cm, minimum height=4em]
\tikzstyle{line} = [draw, -latex']
\tikzstyle{cloud} = [draw, ellipse,text width= 2.9em, fill=red!50, node distance=2cm, minimum height=3em]

\tikzstyle{ioi} = [trapezium, draw, trapezium right angle=120,rounded corners, fill=blue!60, node distance=2.8cm, minimum height=2.7em]
 \tikzstyle{io} = [trapezium, draw, trapezium right angle=110,rounded corners, fill=red!20, node distance=1.9cm, minimum height=2.9em]   % the draw command here is used to draw the boundary of mentioned shape.
\begin{tikzpicture}[node distance = 1.8cm, auto] % the command node distance is important as it determines the space or the length of the arrow between different blocks.
    % the command given below are the place of nodes
    \node [cloud] (init) {Start};
    \node [io, below of=init](A){Step A};
    \node [io, below of=A](B){Step B};
    \node [block, below of = B](C){Step C};
    \node [block, below of = C](D){Step D};
    \node [decision, below of = D](E){Step E};
    \node [document, below of = E](F){Step F};
    \node [cloud, below of = F](G){Step G};
    \node [block1, right of = D](H){Step H};
    \node [ioi, below of = H](I){Step I};
    \node [decision, left of = D](J){Step J};
    \node [ioi, below of = J](K){Step K};
    \path [line] (init) -- (A);
    \path [line] (A) -- (B);
    \path [line] (B) -- (C);
    \path [line] (C) -- (D);
    \path [line] (D) -- (E);
    \path [line] (E) -- (F);
    \path [line] (F) -- (G);
    \path [line] (D) -- (H);
    \path [line] (H) -- (I);
    \path [line] (I) |- (G.east); % |- is used for making the rectangular arrow
    \path [line] (C) |- (J.north); % to position the arrow, you can use north, south, east, and west directions
    \path [line] (J) -- (K);
    \path [line] (K) |- (F.west);
    \path [line, dashed] (H) |- (init.east); % the dashed command is used to create the dashed line

\end{tikzpicture}
\end{document}
输出:
