在本文中,我们将讨论如何使用MATLAB开发数字助听器。
MATLAB代表Matrix Laboratory。这是一种用于技术计算的高性能语言。它允许矩阵处理,功能绘制,算法实现和用户界面创建。它既是一种编程语言,又是一种编程环境。它允许在命令窗口本身中计算语句。
分步方法:
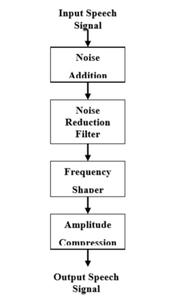
- 我们将输入语音信号提供给MATLAB模型。
- 然后,我们将噪声添加到语音输入信号中,因为对于该系统,输入信号是纯净信号,为了模拟真实情况,添加了一些噪声。
- 现在我们使用小波滤波器来减少噪声。
- 我们使用频率整形器来纠正某些频率的听力损失。
- 幅度压缩用于改善信号增益。
基于以上方法的流程图:
这里我们使用AWGN(加性高斯白噪声),因为AWGN是数据假设中用来模拟自然界中任意循环的影响的基本模型。 AWGN在指定频带上具有连续且均匀的频谱,并且该频带的每赫兹功率相等。

算法
MATLAB
clc

clear

close all

% disp('recording...');
% recObj = audiorecorder;
% recordblocking(recObj,5);
% disp('recorded');
% %%

% disp('playing recorded sound...');
% play(recObj);
% pause(7);
%%

% y = getaudiodata(recObj);
% input= 'Counting-16-44p1-mono-15secs.wav';

disp('input sound')

% input = 'audio.wav';
% [in,fs] = audioread(input);
% [y,fs] = audioread(input);

load handel.mat

fs=Fs;

y = y(:, 1);

% info = audioinfo(input);

sound(y);
pause(10);

figure,plot(y);
title('input');
xlabel('samples');
ylabel('amplitude');

y = awgn(y,40);
noi = y;
figure,plot(y);

xlabel('samples');
ylabel('amplitude');
title('awgn');
disp('playing added noise...');
sound(y);
pause(10)

%'Fp,Fst,Ap,Ast' (passband frequency, stopband frequency, passband ripple, stopband attenuation)

hlpf = fdesign.lowpass('Fp,Fst,Ap,Ast',3.0e3,3.5e3,0.5,50,fs);
D = design(hlpf);
freqz(D);
x = filter(D,y);

disp('playing denoised sound');
figure,plot(x);
title('denoise');
sound(x,fs);

xlabel('samples');
ylabel('amplitude');
pause(10)

% freq shaper using band pass

T = 1/fs;
len = length(x);
p = log2(len);
p = ceil(p);
N = 2^p;
f1 = fdesign.bandpass('Fst1,Fp1,Fp2,Fst2,Ast1,Ap,Ast2',2000,3000,4000,5000,60,2,60,2*fs);
hd = design(f1,'equiripple');
y = filter(hd,x);
freqz(hd);
y = y*100;

disp('playing frequency shaped...');
sound(y,fs);
pause(10);

% amplitude shaper

disp('amplitude shaper')
out1=fft(y);
phse=angle(out1);
mag=abs(out1)/N;
[magsig,~]=size(mag);
threshold=1000;
out=zeros(magsig,1);

for i=1:magsig/2

   if(mag(i)>threshold)
       mag(i)=threshold;mag(magsig-i)=threshold;

   end

   out(i)=mag(i)*exp(j*phse(i));
   out(magsig-i)=out(i);

end

outfinal=real(ifft(out))*10000;
disp('playing amplitude shaped...');
sound(outfinal,fs);
pause(10);

load handel.mat
figure;
subplot(2,1,1);
specgram(noi);
title('Spectrogram of Original Signal');

subplot(2,1,2);
specgram(outfinal);
title('Spectrogram of Adjusted Signal');
输出: