在 R 编程中为图表添加颜色
R 编程语言主要用于统计和数据分析目的,以在软件中以图形方式表示数据。为了以图形方式表示这些数据,R 中使用了图表和图形。
在 R 编程中为图表添加颜色
R中存在数百种图表和图形。例如,条形图,箱形图,马赛克图,点图,coplot,直方图,饼图,散点图等。我们可以直观地增强我们的图表并使其更具吸引力通过颜色。 col 图形参数用于此目的。所需颜色的名称可以用字符串表示。
Syntax: barplot( A, col=color_name)
例子:
R
# Creating a list
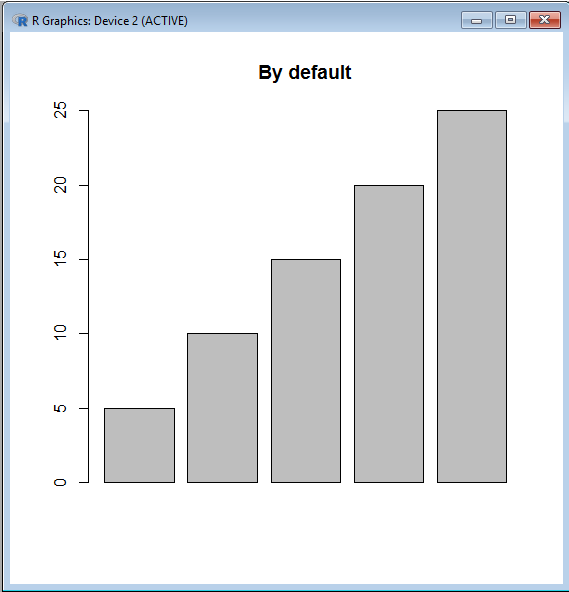
temp<-c(5, 10, 15, 20, 25)
# Barplot with default color
barplot(temp, main ="By default")
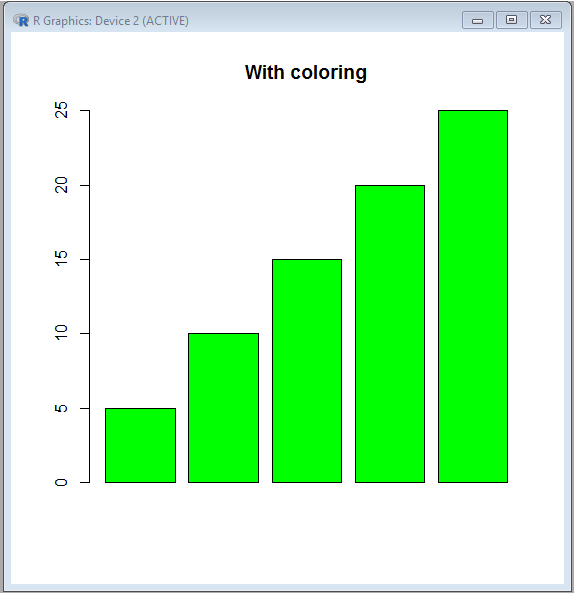
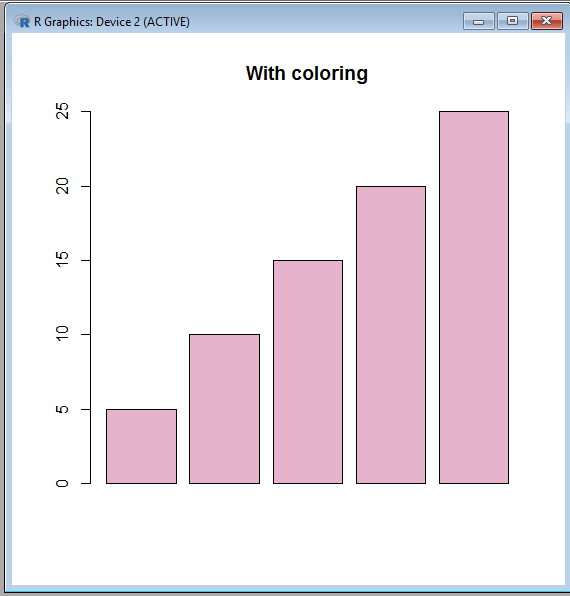
# Barplot with green color
barplot(temp, col ="green",
main ="With coloring")R
# Creating a list
temp<-c(5, 10, 15, 20, 25)

# Creating barplot
barplot(temp, col = colors()[655],
        main ="With coloring")
R
rgb (0.9, 0.7, 0.8)
rgb(5, 0, 70, max = 255)
R
# Creating a list
temp<-c(5, 10, 15, 20, 25)

# Creating barplot
barplot(temp, col = rgb(5, 0, 70, max = 255),
        main ="With coloring")
Python3
# Creating a list
temp<-c(5, 10, 15, 20, 25)

# Creating barplot
barplot(temp, col = rgb (0.9, 0.7, 0.8),
        main ="With coloring")
R
temp<-c(5, 10, 15, 20, 25)
barplot(temp, col = c("# F50629", "# 00FFAA",
                    "# AAFF33", "# 336622",
                    "# 5F2910"),
        main ="With 5 colors")
R
temp<-c(5, 10, 15, 20, 25)
barplot(temp, col = c("# F50629", "# 00FFAA",
                    "# AAFF33"),
        main ="With 3 colors")
R
rainbow(5)
heat.colors(5)
terrain.colors(5)
topo.colors(5)
R
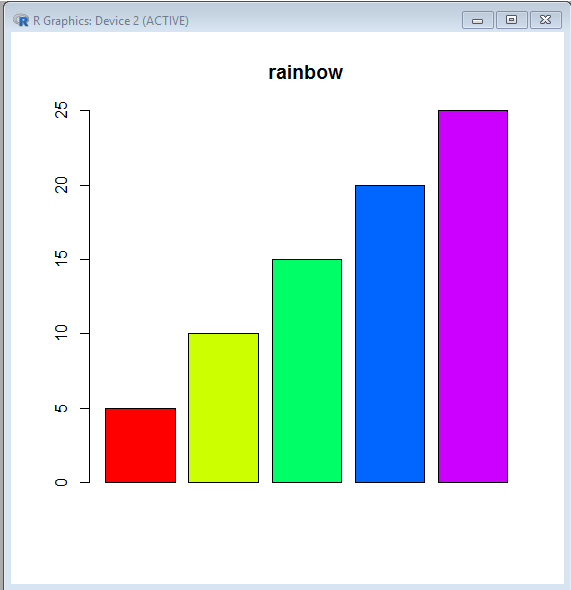
temp<-c(5, 10, 15, 20, 25)
barplot(temp, col = rainbow(5),
        main ="rainbow")
输出:
R – 图表的颜色
R 语言中存在多种 657 种颜色,以便更好地呈现数据。通过colors()函数,我们可以了解 R 中存在的所有鲜艳的颜色。显示的颜色名称按字母顺序排列(除了显示的第一种颜色“白色”之外)。
对于在代码中使用颜色,要么使用它的名称,要么使用它的订单号。
例子:
R
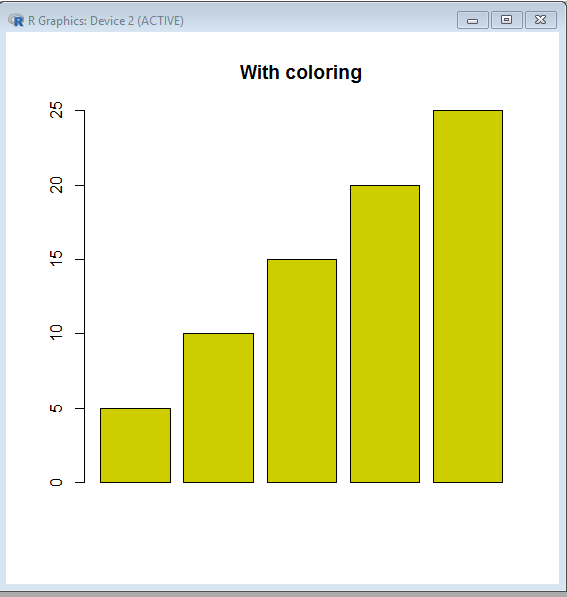
# Creating a list
temp<-c(5, 10, 15, 20, 25)

# Creating barplot
barplot(temp, col = colors()[655],
        main ="With coloring")
输出:
使用十六进制值
虽然记住颜色名称更容易,但有时颜色是由已经为 R 中的每种颜色预定义的唯一十六进制数字定义的。十六进制数字的六位长度采用 #RRGGBB 格式。
这种格式的字母表示:
- RR – 红色
- GG——绿色
- BB – 蓝色
红色、绿色和蓝色的颜色代码范围从 00 到 FF。然后红色、绿色和蓝色的颜色代码将形成一个六位长度的十六进制数,它表示通过混合所有定义的阴影形成的颜色。

因此,三个基本的纯色调可以写成:
- #FF0000 红
- #00FF00 绿色
- #0000FF 蓝色
没有颜色时,阴影为白色 (000000)。当所有颜色都存在时,阴影为黑色(FFFFFF)。
使用 RGB 值
函数RGB 在 0 和 1 之间指定红色、绿色和蓝色的阴影。进一步将这三个基本成分的指定阴影混合形成新的阴影。红色、绿色和蓝色的阴影也可以在 0 到 255 之间指定。但是在使用此范围时会添加一个参数 max=255。
函数rgb()将返回指定阴影的相应十六进制代码。
R
rgb (0.9, 0.7, 0.8)
rgb(5, 0, 70, max = 255)
输出:
[1] "#E6B3CC"
[1] "#050046"
示例:使用 0-255 之间的阴影
R
# Creating a list
temp<-c(5, 10, 15, 20, 25)

# Creating barplot
barplot(temp, col = rgb(5, 0, 70, max = 255),
        main ="With coloring")
输出:
示例:使用 0 到 1 之间的阴影
Python3
# Creating a list
temp<-c(5, 10, 15, 20, 25)

# Creating barplot
barplot(temp, col = rgb (0.9, 0.7, 0.8),
        main ="With coloring")
输出:

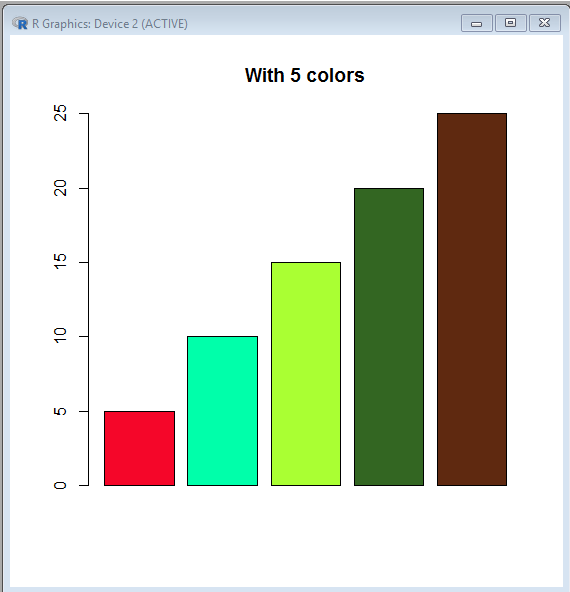
颜色矢量
如果我们需要用各种颜色来表示条形图的每个条形怎么办?在这种情况下,会创建一个颜色向量,这在 R 中也称为颜色循环。
R
temp<-c(5, 10, 15, 20, 25)
barplot(temp, col = c("# F50629", "# 00FFAA",
                    "# AAFF33", "# 336622",
                    "# 5F2910"),
        main ="With 5 colors")
输出:
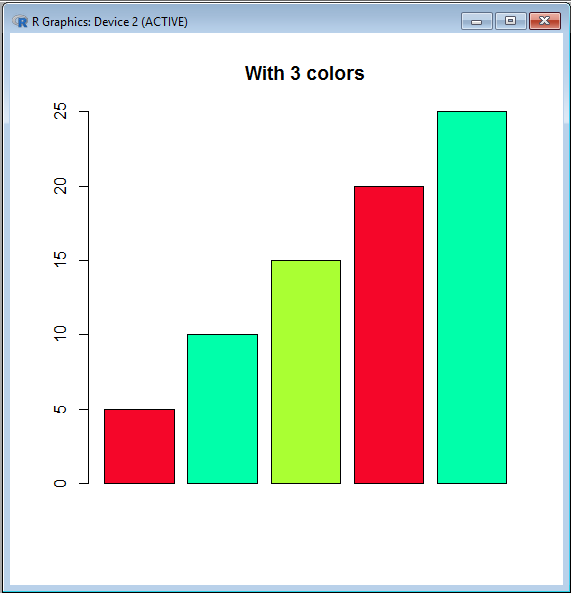
如果提供的向量的长度小于条形图中存在的条数,则重新使用颜色向量。
R
temp<-c(5, 10, 15, 20, 25)
barplot(temp, col = c("# F50629", "# 00FFAA",
                    "# AAFF33"),
        main ="With 3 colors")
输出:
调色板
R 语言提供了五个内置调色板,用于轻松快速地生成颜色矢量。他们是:
- 彩虹()
- 地形.颜色()
- 热色()
- cm.colors()
- 拓扑颜色()
所有所述函数都将颜色矢量的所需长度作为参数值。该函数返回可用颜色的十六进制代码。这个十六进制代码是八位数字。这是因为最后两位数字指定了透明度(其中 FF 是不透明的,00 是透明的)
R
rainbow(5)
heat.colors(5)
terrain.colors(5)
topo.colors(5)
输出:
[1] "#FF0000" "#CCFF00" "#00FF66" "#0066FF" "#CC00FF"

[1] "#FF0000" "#FF5500" "#FFAA00" "#FFFF00" "#FFFF80"

[1] "#00A600" "#E6E600" "#EAB64E" "#EEB99F" "#F2F2F2"

[1] "#4C00FF" "#004CFF" "#00E5FF" "#00FF4D" "#FFFF00"
R
temp<-c(5, 10, 15, 20, 25)
barplot(temp, col = rainbow(5),
        main ="rainbow")
输出: