Python| Pandas Dataframe.plot.bar
Python是一种用于进行数据分析的出色语言,主要是因为以数据为中心的Python包的奇妙生态系统。 Pandas就是其中之一,它使导入和分析数据变得更加容易。
Pandas DataFrame.plot.bar()以矩形条的形式垂直绘制图形。
Syntax : DataFrame.plot.bar(x=None, y=None, **kwds)
Parameters:
x : (label or position, optional) Allows plotting of one column versus another. If not specified, the index of the DataFrame is used.
y : (label or position, optional) Allows plotting of one column versus another. If not specified, all numerical columns are used.
**kwds : Additional keyword arguments
Returns: matplotlib.axes.Axes or np.ndarray of them
示例 #1:使用DataFrame.plot.bar()以矩形条的形式垂直绘制图形
# importing matplotlib
import matplotlib.pyplot

# importing pandas as pd
import pandas as pd

# importing numpy as np
import numpy as np

# creating a dataframe
df = pd.DataFrame(np.random.rand(10, 3), columns =['a', 'b', 'c'])

print(df)

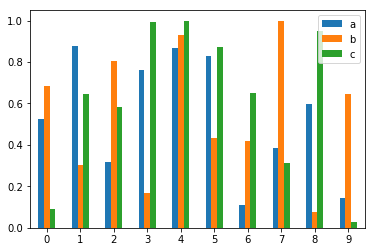
现在我们将使用函数DataFrame.plot.bar()以矩形条的形式垂直绘制图形
# using a function df.plot.bar()
df.plot.bar()
输出:  示例 #2:使用
DataFrame.plot.bar()以矩形条的形式垂直绘制图形。
# importing matplotlib
import matplotlib.pyplot

# importing pandas as pd
import pandas as pd

# importing numpy as np
import numpy as np

# creating a dataframe
df = pd.DataFrame(np.random.rand(10, 10),
                  columns =['a', 'b', 'c', 'd', 'e', 'f', 'g', 'h', 'i', 'j'])

df

现在我们将使用函数DataFrame.plot.bar()以矩形条的形式垂直绘制图形
# using a function df.plot.bar()
df.plot.bar()
输出 : 