Python|使用 Networkx 的聚类、连接性和其他 Graph 属性
图的三元闭包是具有共同邻居的节点在它们之间具有边的趋势。如果在图中添加更多边,这些边往往会形成。例如在下图中:
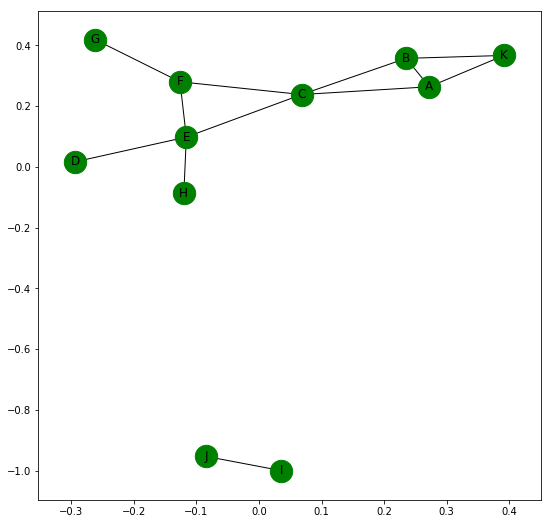
接下来最有可能形成的边是 (B, F)、(C, D)、(F, H) 和 (D, H),因为这些对共享一个共同的邻居。
图中节点的局部聚类系数是节点的相邻节点对的比例。例如上图的节点 C 有四个相邻的节点 A、B、E 和 F。
Number of possible pairs that can be formed using these 4 nodes are 4*(4-1)/2 = 6.
Number of actual pairs that are adjacent to each other = 2. These are (A, B) and (E, F).
Thus Local Clustering Coefficient for node C in the given Graph = 2/6 = 0.667
Networkx 帮助我们轻松获得聚类值。
Python3
import networkx as nx

G = nx.Graph()

G.add_edges_from([('A', 'B'), ('A', 'K'), ('B', 'K'), ('A', 'C'),
                  ('B', 'C'), ('C', 'F'), ('F', 'G'), ('C', 'E'),
                  ('E', 'F'), ('E', 'D'), ('E', 'H'), ('I', 'J')])

# returns a Dictionary with clustering value of each node
print(nx.clustering(G))

# This returns clustering value of specified node
print(nx.clustering(G, 'C'))
Python3
import networkx as nx

G = nx.Graph()

G.add_edges_from([('A', 'B'), ('A', 'K'), ('B', 'K'), ('A', 'C'),
                  ('B', 'C'), ('C', 'F'), ('F', 'G'), ('C', 'E'),
                  ('E', 'F'), ('E', 'D'), ('E', 'H'), ('I', 'J')])

nx.draw_networkx(G, with_labels = True, node_color ='green')

# returns True or False whether Graph is connected
print(nx.is_connected(G))

# returns number of different connected components
print(nx.number_connected_components(G))

# returns list of nodes in different connected components
print(list(nx.connected_components(G)))

# returns list of nodes of component containing given node
print(nx.node_connected_component(G, 'I'))

# returns number of nodes to be removed
# so that Graph becomes disconnected
print(nx.node_connectivity(G))

# returns number of edges to be removed
# so that Graph becomes disconnected
print(nx.edge_connectivity(G))
Python3
import networkx as nx
import matplotlib.pyplot as plt

G = nx.Graph()
G.add_edges_from([('A', 'B'), ('A', 'K'), ('B', 'K'), ('A', 'C'),
                  ('B', 'C'), ('C', 'F'), ('F', 'G'), ('C', 'E'),
                  ('E', 'F'), ('E', 'D'), ('E', 'H'), ('H', 'I'), ('I', 'J')])

plt.figure(figsize =(9, 9))
nx.draw_networkx(G, with_labels = True, node_color ='green')

print(nx.shortest_path(G, 'A'))
# returns dictionary of shortest paths from A to all other nodes

print(int(nx.shortest_path_length(G, 'A')))
# returns dictionary of shortest path length from A to all other nodes

print(nx.shortest_path(G, 'A', 'G'))
# returns a shortest path from node A to G

print(nx.shortest_path_length(G, 'A', 'G'))
# returns length of shortest path from node A to G

print(list(nx.all_simple_paths(G, 'A', 'J')))
# returns list of all paths from node A to J

print(nx.average_shortest_path_length(G))
# returns average of shortest paths between all possible pairs of nodes
Python3
import networkx as nx
import matplotlib.pyplot as plt

G = nx.Graph()
G.add_edges_from([('A', 'B'), ('A', 'K'), ('B', 'K'), ('A', 'C'),
                  ('B', 'C'), ('C', 'F'), ('F', 'G'), ('C', 'E'),
                  ('E', 'F'), ('E', 'D'), ('E', 'H'), ('H', 'I'), ('I', 'J')])

plt.figure(figsize =(9, 9))
nx.draw_networkx(G, with_labels = True, node_color ='green')

print("Eccentricity: ", nx.eccentricity(G))
print("Diameter: ", nx.diameter(G))
print("Radius: ", nx.radius(G))
print("Preiphery: ", list(nx.periphery(G)))
print("Center: ", list(nx.center(G)))
Output:
{'A': 0.6666666666666666,
'B': 0.6666666666666666,
'C': 0.3333333333333333,
'D': 0,
'E': 0.16666666666666666,
'F': 0.3333333333333333,
'G': 0,
'H': 0,
'I': 0,
'J': 0,
'K': 1.0}
0.3333333333333333如何获得整个图的聚类值?
有两种不同的方法可以找到它:
1. 我们可以对单个节点的所有局部聚类系数进行平均,即所有节点的局部聚类系数之和除以节点总数。
nx.average_clustering(G) 是找出它的代码。在上面给出的图表中,这将返回一个值 0.28787878787878785。
2.我们可以测量图的传递性。
Transitivity of a Graph = 3 * Number of triangles in a Graph / Number of connected triads in the Graph.
换句话说,它是封闭三元组数与开放三元组数之比的三倍。

这是一个封闭的三合会
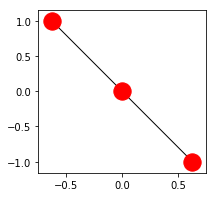
这是一个开放的三合会。
nx.transitivity(G) 是获取传递性的代码。在上面给出的图表中,它返回一个值 0.4090909090909091。
现在,我们知道上面给出的图是不连通的。 Networkx 提供了许多内置函数来检查图形的各种连接功能。
下面的代码更好地说明了它们:
Python3
import networkx as nx

G = nx.Graph()

G.add_edges_from([('A', 'B'), ('A', 'K'), ('B', 'K'), ('A', 'C'),
                  ('B', 'C'), ('C', 'F'), ('F', 'G'), ('C', 'E'),
                  ('E', 'F'), ('E', 'D'), ('E', 'H'), ('I', 'J')])

nx.draw_networkx(G, with_labels = True, node_color ='green')

# returns True or False whether Graph is connected
print(nx.is_connected(G))

# returns number of different connected components
print(nx.number_connected_components(G))

# returns list of nodes in different connected components
print(list(nx.connected_components(G)))

# returns list of nodes of component containing given node
print(nx.node_connected_component(G, 'I'))

# returns number of nodes to be removed
# so that Graph becomes disconnected
print(nx.node_connectivity(G))

# returns number of edges to be removed
# so that Graph becomes disconnected
print(nx.edge_connectivity(G))
输出:
False
2
[{'B', 'H', 'C', 'A', 'K', 'E', 'F', 'D', 'G'}, {'J', 'I'}]
{'J', 'I'}
0
0
有向图的连通性——
如果对于每对节点 u 和 v,都存在从 u 到 v 和 v 到 u 的有向路径,则有向图是强连通的。
如果用无向边替换有向图的所有边将产生无向连通图,则它是弱连通的。可以通过以下代码检查它们:
nx.is_strongly_connected(G)
nx.is_weakly_connected(G)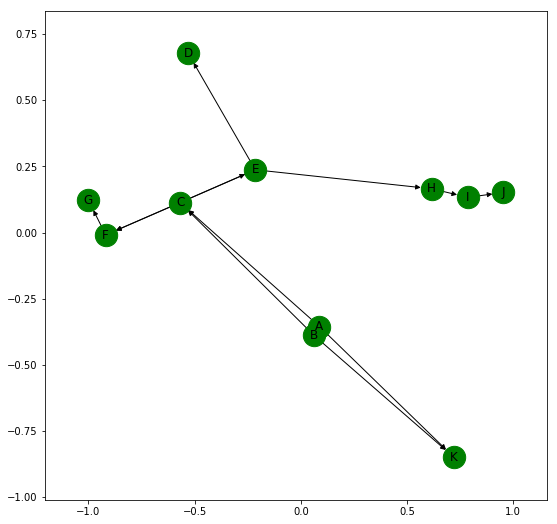
给定的有向图是弱连接的,不是强连接的。
Networkx 允许我们在图中轻松找到节点之间的路径。让我们仔细检查下图:
Python3
import networkx as nx
import matplotlib.pyplot as plt

G = nx.Graph()
G.add_edges_from([('A', 'B'), ('A', 'K'), ('B', 'K'), ('A', 'C'),
                  ('B', 'C'), ('C', 'F'), ('F', 'G'), ('C', 'E'),
                  ('E', 'F'), ('E', 'D'), ('E', 'H'), ('H', 'I'), ('I', 'J')])

plt.figure(figsize =(9, 9))
nx.draw_networkx(G, with_labels = True, node_color ='green')

print(nx.shortest_path(G, 'A'))
# returns dictionary of shortest paths from A to all other nodes

print(int(nx.shortest_path_length(G, 'A')))
# returns dictionary of shortest path length from A to all other nodes

print(nx.shortest_path(G, 'A', 'G'))
# returns a shortest path from node A to G

print(nx.shortest_path_length(G, 'A', 'G'))
# returns length of shortest path from node A to G

print(list(nx.all_simple_paths(G, 'A', 'J')))
# returns list of all paths from node A to J

print(nx.average_shortest_path_length(G))
# returns average of shortest paths between all possible pairs of nodes
输出:
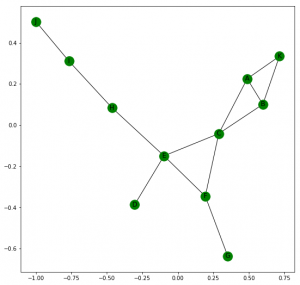
{‘A’: [‘A’],
‘B’: [‘A’, ‘B’],
‘C’: [‘A’, ‘C’],
‘D’: [‘A’, ‘C’, ‘E’, ‘D’],
‘E’: [‘A’, ‘C’, ‘E’],
‘F’: [‘A’, ‘C’, ‘F’],
‘G’: [‘A’, ‘C’, ‘F’, ‘G’],
‘H’: [‘A’, ‘C’, ‘E’, ‘H’],
‘I’: [‘A’, ‘C’, ‘E’, ‘H’, ‘I’],
‘J’: [‘A’, ‘C’, ‘E’, ‘H’, ‘I’, ‘J’],
‘K’: [‘A’, ‘K’]}
{‘A’: 0,
‘B’: 1,
‘C’: 1,
‘D’: 3,
‘E’: 2,
‘F’: 2,
‘G’: 3,
‘H’: 3,
‘I’: 4,
‘J’: 5,
‘K’: 1}
[‘A’, ‘C’, ‘F’, ‘G’]
3
[[‘A’, ‘C’, ‘F’, ‘E’, ‘H’, ‘I’, ‘J’], [‘A’, ‘C’, ‘E’, ‘H’, ‘I’, ‘J’], [‘A’, ‘K’, ‘B’, ‘C’, ‘F’, ‘E’, ‘H’, ‘I’, ‘J’], [‘A’, ‘K’, ‘B’, ‘C’, ‘E’, ‘H’, ‘I’, ‘J’], [‘A’, ‘B’, ‘C’, ‘F’, ‘E’, ‘H’, ‘I’, ‘J’], [‘A’, ‘B’, ‘C’, ‘E’, ‘H’, ‘I’, ‘J’]]
2.6363636363636362
图表的几个重要特征——
- 偏心率:对于图 G 中的节点 n,n 的偏心率是 n 与所有其他节点之间可能的最大最短路径距离。
- 直径:图 G 中一对节点之间的最大最短距离是它的直径。它是节点的最大可能偏心率值。
- 半径:它是节点的最小偏心率值。
- 外围:它是其偏心率等于其直径的一组节点。
- 中心:图的中心是一组节点,其偏心率等于图的半径。
Networkx 提供了用于计算所有这些属性的内置函数。
Python3
import networkx as nx
import matplotlib.pyplot as plt

G = nx.Graph()
G.add_edges_from([('A', 'B'), ('A', 'K'), ('B', 'K'), ('A', 'C'),
                  ('B', 'C'), ('C', 'F'), ('F', 'G'), ('C', 'E'),
                  ('E', 'F'), ('E', 'D'), ('E', 'H'), ('H', 'I'), ('I', 'J')])

plt.figure(figsize =(9, 9))
nx.draw_networkx(G, with_labels = True, node_color ='green')

print("Eccentricity: ", nx.eccentricity(G))
print("Diameter: ", nx.diameter(G))
print("Radius: ", nx.radius(G))
print("Preiphery: ", list(nx.periphery(G)))
print("Center: ", list(nx.center(G)))
输出:
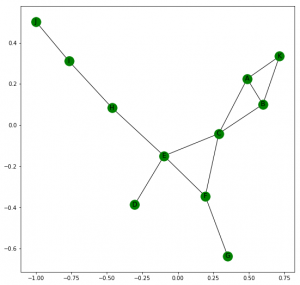
Eccentricity: {‘A’: 5, ‘K’: 6, ‘B’: 5, ‘H’: 4, ‘J’: 6, ‘E’: 3, ‘C’: 4, ‘I’: 5, ‘F’: 4, ‘D’: 4, ‘G’: 5}
Diameter: 6
Radius: 3
Periphery: [‘K’, ‘J’]
Center: [‘E’]
参考: https://networkx.github.io/documentation。