在 R 中的 ggplot2 图中绘制到 X 轴类日期的垂直线
在本文中,我们将看到如何在 R 编程语言的 ggplot2 Plot 中绘制到类日期 X 轴的垂直线。这里我们使用散点图,您可以根据需要绘制任何图形。
首先,使用library()函数加载 ggplot2 包。现在我们将创建一个 DataFrame,其中分别包含 X 轴和 Y 轴的两个向量。这里使用从开始到结束的日期序列作为绘图的 X 轴值。为此,我们必须使用 R 函数,例如“seq()”和“as.Date()”。 seq()函数生成日期序列。
Syntax : seq(…, length, by)
Parameters :
- Generally seq function has many parameters but here we use only required parameters out of these.
- … : arguments passed to be sequenced. here we want to sequence dates. So that we use as.Date() function as a first parameter of seq.
- length : desired length of the sequence. here we want 60 months of dates. So we give the value 60 to length parameter.
- by : increment of sequence. here we give the value ‘1 month’ to by parameter for increment dates by 1 month.
Return : Regular Sequences as per given arguments.
as.Date()函数将其中分配的对象转换为表示日历日期的“Date”类。
Syntax : as.Date(x, origin)
Parameters :
- x : An object to be converted. this is necessary to assign to as.Date . if we have not any object to be convert, we can use ‘0’ as a value.
- origin : a ‘Date’ object
Return : An object of class ‘Date’
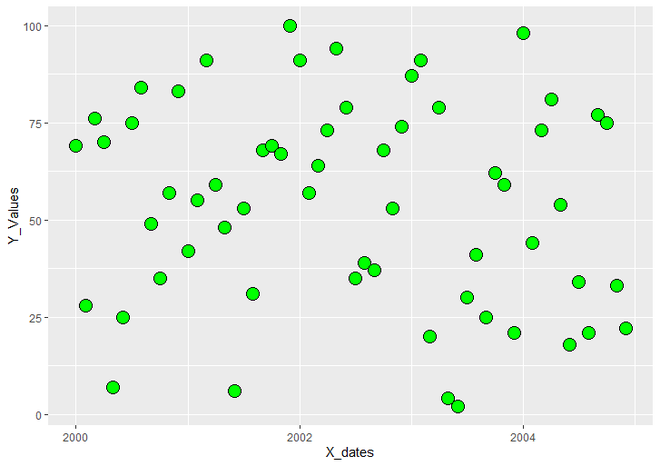
现在要创建 R 图,我们使用 ggplot()函数并使其成为散点图,我们将 geom_point()函数添加到 ggplot()函数。
让我们先把它想象成正常的,这样差异就很明显了。
例子:
R
# Load Packages
library("ggplot2")

# Create DataFrame for plotting with Date class.
data <- data.frame(X_dates = seq(as.Date(0, origin = "2000-01-01"),
                                 length = 60, by = "1 month"),
                   Y_Values = sample(1:100, 60, replace = TRUE))

# Create Scatter Plot by using ggplot2
simplePlot <- ggplot(data, aes(X_dates, Y_Values))+
  geom_point(fill = "green", size = 5, color = "black", shape = 21)
simplePlot
R
# Load ggplot2 Package
library("ggplot2")

# Create DataFrame for plotting
data <- data.frame(X_dates = seq(as.Date(0, origin = "2000-01-01"),
                                 length = 60, by = "1 month"),
                   Y_Values = sample(1:100, 60, replace = TRUE))

# Assign range of the dates to
# date_range object
date_range <- which(data$X_dates %in% as.Date(
  c("2001-12-01", "2003-11-01")) )

# Create ggplot2 ScatterPlot with vertical
# line to X Axis of Class 'Date'
vlinedPlot <- ggplot(data, aes(X_dates, Y_Values)) +
  geom_point(fill = "green", size = 5, color = "black", shape = 21)+
  geom_vline(xintercept = as.numeric(data$X_dates[date_range]),
             color = "dark green", size = 2)
vlinedPlot
输出:

使用 ggplot2 的散点图
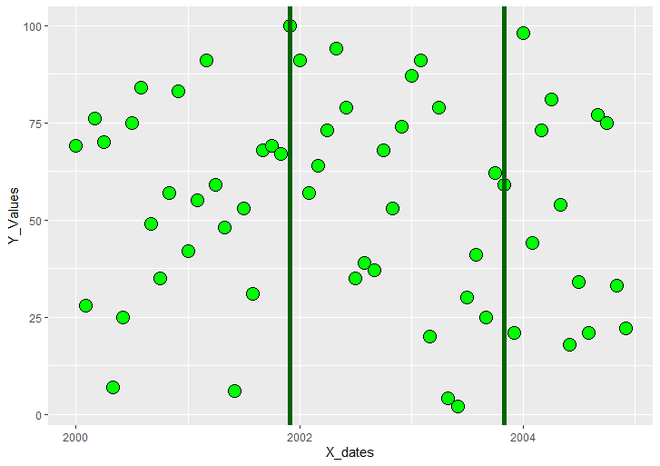
现在要绘制到类日期 X 轴的垂直线,我们必须定义要绘制垂直线的日期范围。为此,我们创建“date_range”对象并为其分配日期范围。在这里,我们使用 as.Date()函数选择日期范围,并使用 which()函数从 X 轴值中选择日期。 which()函数返回满足给定条件的值的索引。
Syntax : which(x)
Parameter :
- which() has mainly has three parameters x, arr,ind and useNames but only ‘x’ is the necessary to use. Here we have not use other two parameters.
- x : An input logical vector or you can say it is a condition by which we want to extract values.
Return : returns the position of the values from the logical vector or condition.
以下是用于分配日期范围的语法。
句法:
date_range <- which(data$X_dates %in% as.Date(c(“start_date”, “end_date”)) )
现在为了绘制要绘制的垂直线,我们将 geom_vline()函数添加到 geom_point() 中,该函数在 X 轴的给定值上绘制垂直线。在 geom_vline() 中,我们使用参数“xintercept”来控制线在 X 轴上的位置。我们使用 as.numeric()函数为 xintercept 提供索引日期返回的日期范围的数值。
Syntax : geom_vline(xintercept)
Parameter : here xintercept is used control the X position of line.
Return : Vertical line on R plot.
例子:
电阻
# Load ggplot2 Package
library("ggplot2")

# Create DataFrame for plotting
data <- data.frame(X_dates = seq(as.Date(0, origin = "2000-01-01"),
                                 length = 60, by = "1 month"),
                   Y_Values = sample(1:100, 60, replace = TRUE))

# Assign range of the dates to
# date_range object
date_range <- which(data$X_dates %in% as.Date(
  c("2001-12-01", "2003-11-01")) )

# Create ggplot2 ScatterPlot with vertical
# line to X Axis of Class 'Date'
vlinedPlot <- ggplot(data, aes(X_dates, Y_Values)) +
  geom_point(fill = "green", size = 5, color = "black", shape = 21)+
  geom_vline(xintercept = as.numeric(data$X_dates[date_range]),
             color = "dark green", size = 2)
vlinedPlot
输出:

带有垂直线到类日期 X 轴的散点图