使用 ggplot2 在 R 中绘制饼图
饼图或圆图是一种圆形统计图形技术,它按数字比例划分圆以将数据表示为整体的一部分。在圆图中,每个切片的弧长与其代表的数量成正比。饼图在商业世界和大众媒体中被非常广泛地用于了解趋势。
方法
- 导入模块
- 创建数据
- 按选定列的值排列数据框的行。
- 变异为 从数据集创建一个新变量
- 绘制饼图
- 显示图
示例 1:
R
library(ggplot2)
library(dplyr)

count.data <- data.frame(
    pilot_class = c("A++(Senior pilot)", "A+(Junior pilot)", "A-(Trainee pilot)", "Crew"),
    n = c(389, 256, 589, 466),
    proportion = c(22.88, 15.0588, 34.647, 27.411)
)

count.data

count.data <- count.data %>%
    arrange(desc(pilot_class)) %>%
    mutate(lab.ypos = cumsum(proportion) - 0.6*proportion)

count.data

mycols <- c("#42f55a", "#42f5e6", "#ecf542", "#f56f42")

ggplot(count.data, aes(x = "", y = proportion, fill = pilot_class)) +
    geom_bar(width = 1, stat = "identity", color = "black") +
    coord_polar("y", start = 0)+
    geom_text(aes(y = lab.ypos, label = proportion), color = "black")+
    scale_fill_manual(values = mycols) +
    theme_void()
R
Name_of_student <- c("Ankit", "Jack", "Prakhar", "Madahav", "shef",
            "sama", "karthik", "Ritwik", "Agnim", "Harsh")

contribution_in_project <- c(.103, .097, .103, .103,.097, .097, .10,.10,.10,.10 )

top_ten_contributors <- data.frame(Name_of_student,contribution_in_project)
top_ten_contributors

pie_2 <- ggplot(top_ten_contributors, aes(x = factor(1), fill = factor(contribution_in_project))) +
    geom_bar(width = 1)

pie_2 + coord_polar(theta = "y")
输出:

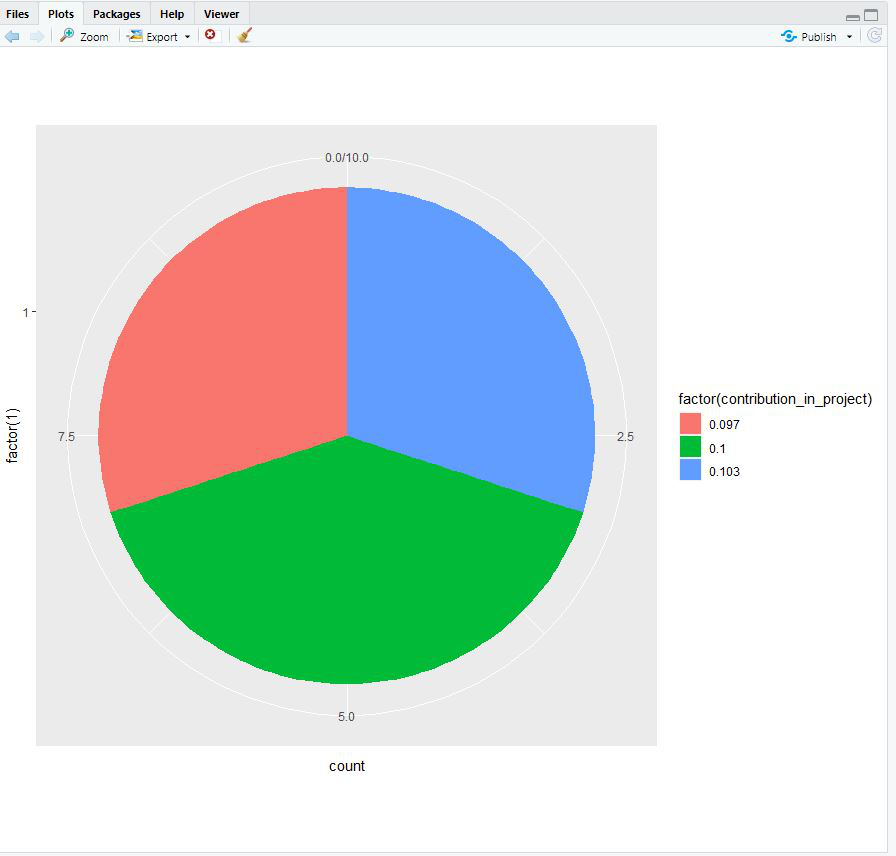
示例 2:
电阻
Name_of_student <- c("Ankit", "Jack", "Prakhar", "Madahav", "shef",
            "sama", "karthik", "Ritwik", "Agnim", "Harsh")

contribution_in_project <- c(.103, .097, .103, .103,.097, .097, .10,.10,.10,.10 )

top_ten_contributors <- data.frame(Name_of_student,contribution_in_project)
top_ten_contributors

pie_2 <- ggplot(top_ten_contributors, aes(x = factor(1), fill = factor(contribution_in_project))) +
    geom_bar(width = 1)

pie_2 + coord_polar(theta = "y")
输出: