从 R 中的数据框列表中绘制列
在本文中,我们将讨论如何使用 R 编程语言从数据框列表中绘制列。
注意:我们正在使用线图来实现同样可以应用于任何其他图。
ggplot() 方法辅以不同的几何形状来表示数据绘图的类型。 geom_line() 方法用于以线的形式绘制数据。
句法:
geom_line()
我们将在基础 R 中使用 lapply() 方法,该方法应用一个函数,该函数可以是用户定义的或预定义到输入数据对象的。
Syntax:
lapply(list-of-data-frame, FUN)
Parameter :
- list-of-data-frame – The list of dataframes formed.
- FUN – The FUN here is the ggplot() method along with the mappings and geometrical plot visualizations to be used.
让我们转向实施,以更好地理解这个概念。
示例 1:从包含两个数据框的列表中绘制列
R
library("ggplot2")

# create first dataframe
data_frame1<-data.frame(col1=c(rep('Jan2021',5),
                               rep('Feb2021',5),
                               rep('Mar2021',5)),
                col2=rnorm(15),
                col3=rep(1:5,3)
                )

# create second dataframe
data_frame2<-data.frame(col1=c(rep('Jan2021',5),
                               rep('Feb2021',5),
                               rep('Mar2021',5)),
                 col2=rnorm(15),
                 col3=rep(1:5,3)
                 )

# creating list of dataframes
data_frames<-list(data_frame1, data_frame2)

graph<-lapply(data_frames,function(x)
  p<-ggplot(x,aes(x= col3,y= col2,color=factor(col1),
                  group=factor(col1))) +
    geom_line() +
    facet_wrap(~col1)
)
print (graph)
R
library("ggplot2")

# create first dataframe
data_frame1<-data.frame(col1=c(rep('Grp1',2),rep('Grp2',2),rep('Grp3',2)),
                col2=rep(letters[1:3],2),
                col3=rep(1:2,3)
                )

# create second dataframe
data_frame2<-data.frame(col1=c(rep('Grp1',2),rep('Grp2',2),rep('Grp3',2)),
                        col2=rep(letters[1:3],2),
                        col3=rep(1:2,3)
)

# creating list of dataframes
data_frames<-list(data_frame1, data_frame2)

graph<-lapply(data_frames,
              function(x)
                p<-ggplot(x,aes(x= col3,y= col2,color=factor(col1),
                                group=factor(col1))) +
                geom_line() +
                facet_wrap(~col1)
)

print (graph)
R
library("ggplot2")

# create first dataframe
data_frame1<-data.frame(col1=c(rep('Jan2021',5),rep('Feb2021',5),rep('Mar2021',5)),
                        col2=rnorm(15),
                        col3=rep(1:5,3)
)

# create second dataframe
data_frame2<-data.frame(col1=c(rep('Grp1',2),rep('Grp2',2),rep('Grp3',2)),
                        col2=rep(letters[1:3],2),
                        col3=rep(1:2,3)
)

# creating list of dataframes
df<-list(data_frame1, data_frame2)

graph<-lapply(df,
              function(x)
                p<-ggplot(x,aes(x= col3,y= col2,color=factor(col1),
                                group=factor(col1))) +
                geom_line() +
                facet_wrap(~col1)
)
print (graph)
输出

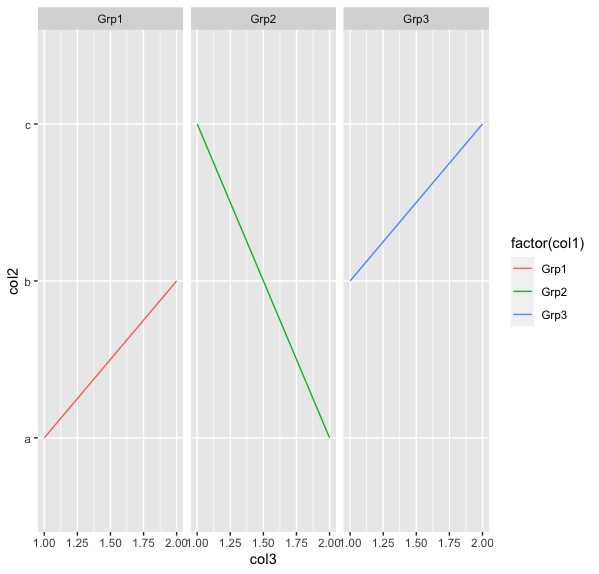
示例 2:显示使用三个数据框形成列表的示例
电阻
library("ggplot2")

# create first dataframe
data_frame1<-data.frame(col1=c(rep('Grp1',2),rep('Grp2',2),rep('Grp3',2)),
                col2=rep(letters[1:3],2),
                col3=rep(1:2,3)
                )

# create second dataframe
data_frame2<-data.frame(col1=c(rep('Grp1',2),rep('Grp2',2),rep('Grp3',2)),
                        col2=rep(letters[1:3],2),
                        col3=rep(1:2,3)
)

# creating list of dataframes
data_frames<-list(data_frame1, data_frame2)

graph<-lapply(data_frames,
              function(x)
                p<-ggplot(x,aes(x= col3,y= col2,color=factor(col1),
                                group=factor(col1))) +
                geom_line() +
                facet_wrap(~col1)
)

print (graph)
输出
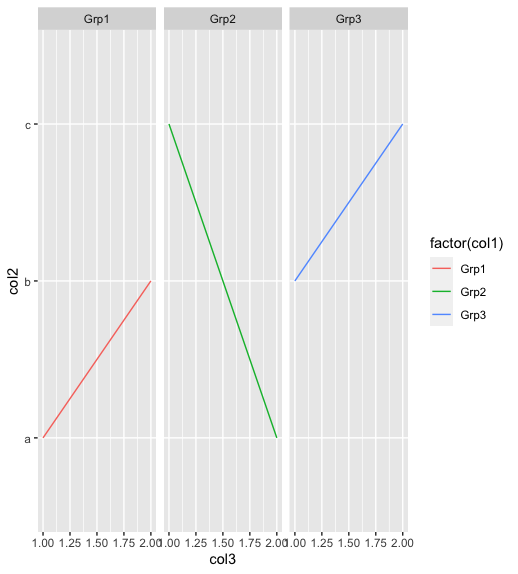
示例 3:绘制不同类型的数据框
电阻
library("ggplot2")

# create first dataframe
data_frame1<-data.frame(col1=c(rep('Jan2021',5),rep('Feb2021',5),rep('Mar2021',5)),
                        col2=rnorm(15),
                        col3=rep(1:5,3)
)

# create second dataframe
data_frame2<-data.frame(col1=c(rep('Grp1',2),rep('Grp2',2),rep('Grp3',2)),
                        col2=rep(letters[1:3],2),
                        col3=rep(1:2,3)
)

# creating list of dataframes
df<-list(data_frame1, data_frame2)

graph<-lapply(df,
              function(x)
                p<-ggplot(x,aes(x= col3,y= col2,color=factor(col1),
                                group=factor(col1))) +
                geom_line() +
                facet_wrap(~col1)
)
print (graph)
输出