使用 R 中的 ggplot2 从数据框列表中绘制线条
在本文中,我们将讨论如何从 R 编程语言中的数据框列表中绘制 ggplot 中的线。
ggplot2 包用于可视化和分析数据。可以在 R 中使用以下命令下载和安装该软件包:
install.packages("ggplot2")R 中的 ggplot 方法用于使用指定的数据框进行图形可视化。它用于实例化 ggplot 对象。可以为绘图对象创建美学映射,以分别确定 x 轴和 y 轴之间的关系。可以将其他组件添加到创建的 ggplot 对象中。
Syntax: ggplot(data = NULL, mapping = aes(), colour())
Arguments :
- data – Default dataset to use for plot.
- mapping – List of aesthetic mappings to use for plot.
可以使用各种方法将几何图形添加到绘图中。 R 中的 geom_line() 方法可用于在绘制的图中添加图形线。它作为组件添加到现有绘图中。审美映射还可以包含基于不同数据框分配不同的颜色属性。 geom_line() 方法具有以下语法:
geom_line()示例 1:
R
# importing required libraries
library("dplyr")
library("ggplot2")


# creating the dataframes
df1 = data.frame(col1=c(1: 10), col2=rnorm(10))
df2 = data.frame(col1=c(5: 10), col2=rnorm(6))
df3 = data.frame(col1=c(2: 12), col2=rnorm(11))

# creating a list of dataframes
samplelist = list(df1, df2, df3)
# plotting the data
graph < - ggplot(bind_rows(samplelist, .id="data_frame"),
                 aes(col1, col2, colour=data_frame)) +
geom_line()

# printing the graph
print(graph)
R
# importing required libraries
library("dplyr")
library("ggplot2")


# creating the dataframes
df1 = data.frame(col1=c(1: 10), col2=letters[1:5])
df2 = data.frame(col1=c(7: 9), col2=letters[5:7])
df3 = data.frame(col1=c(1: 6), col2=rep('e', 6))
df4 = data.frame(col1=c(5, 9, 10), col2=c('x', 'm', 'n'))

print("First DataFrame")
print(df1)

print("Second DataFrame")
print(df2)

print("Third DataFrame")
print(df3)

print("Fourth DataFrame")
print(df4)

# creating a list of dataframes
samplelist = list(df1, df2, df3, df4)

# plotting the data
graph < - ggplot(bind_rows(samplelist, .id="data_frame"),
                 aes(col1, col2, colour=data_frame)) +
geom_line()

# printing the graph
print(graph)
输出
[1] "First Dataframe"
> print(df1)
  col1       col2
1     1  2.6799001
2     2  1.6732359
3     3 -0.2821830
4     4  0.6951255
5     5  0.3629730
6     6  1.6543411
7     7  0.9301622
8     8  0.6858366
9     9  1.3150289
10   10 -0.9306804
> print("Second Dataframe")
[1] "Second Dataframe"
> print(df2)
 col1       col2
1    5 -0.1813050
2    6  1.3543525
3    7  0.0810269
4    8  0.1788353
5    9  1.5264921
6   10  0.3677910
> print("Third Dataframe")
[1] "Third Dataframe"
> print(df3)
  col1       col2
1     2 -1.0602057
2     3 -0.6040208
3     4  1.9346507
4     5  0.5183120
5     6  0.7176499
6     7  0.2908290
7     8  1.4760342
8     9  0.5935123
9    10  0.3882407
10   11  0.8871490
11   12 -0.3974801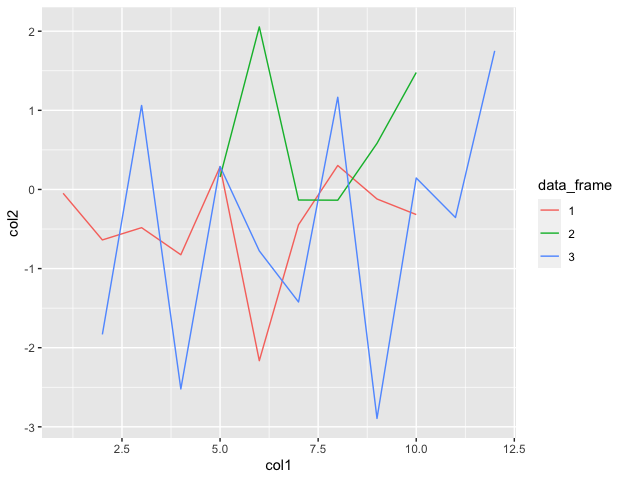
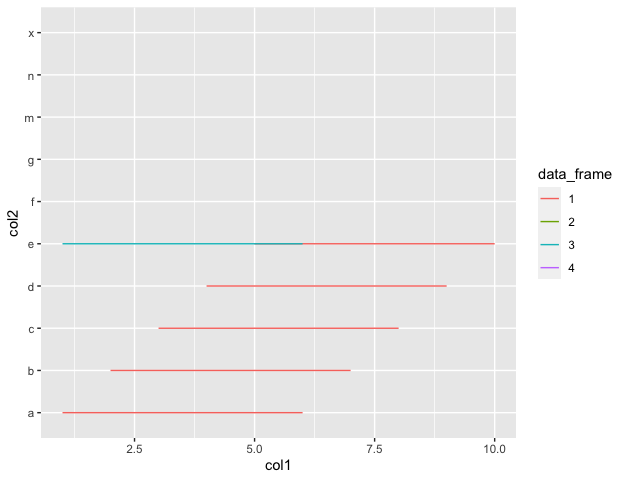
示例 2:
R
# importing required libraries
library("dplyr")
library("ggplot2")


# creating the dataframes
df1 = data.frame(col1=c(1: 10), col2=letters[1:5])
df2 = data.frame(col1=c(7: 9), col2=letters[5:7])
df3 = data.frame(col1=c(1: 6), col2=rep('e', 6))
df4 = data.frame(col1=c(5, 9, 10), col2=c('x', 'm', 'n'))

print("First DataFrame")
print(df1)

print("Second DataFrame")
print(df2)

print("Third DataFrame")
print(df3)

print("Fourth DataFrame")
print(df4)

# creating a list of dataframes
samplelist = list(df1, df2, df3, df4)

# plotting the data
graph < - ggplot(bind_rows(samplelist, .id="data_frame"),
                 aes(col1, col2, colour=data_frame)) +
geom_line()

# printing the graph
print(graph)
输出
[1] "First DataFrame"
> print(df1)
  col1 col2
1     1    a
2     2    b
3     3    c
4     4    d
5     5    e
6     6    a
7     7    b
8     8    c
9     9    d
10   10    e
> print ("Second DataFrame")
[1] "Second DataFrame"
> print(df2)
 col1 col2
1    7    e
2    8    f
3    9    g
> print ("Third DataFrame")
[1] "Third DataFrame"
> print(df3)
 col1 col2
1    1    e
2    2    e
3    3    e
4    4    e
5    5    e
6    6    e
> print ("Fourth DataFrame")
[1] "Fourth DataFrame"
> print(df4)
 col1 col2
1    5    x
2    9    m
3   10    n