PyQtGraph – 条形图
在本文中,我们将看到如何在 PyQtGraph 模块中创建条形图。 PyQtGraph 是一个用于Python的图形和用户界面库,它提供了设计和科学应用程序中通常需要的功能。它的主要目标是提供用于显示数据(绘图、视频等)的快速交互式图形,其次是提供有助于快速应用程序开发的工具(例如,Qt Designer 中使用的属性树)。
条形图是一种可视化一组数据的方法。简单的条形图将数据与一个自变量进行比较,并且可以与设定点或数据范围相关。复杂条形图将数据与两个自变量进行比较。任一类型的图形都可以水平或垂直定向。条形图是在 PyQtGraph 中的 BarGraphItem 类的帮助下创建的。
In order to plot the bar graph in PyQtGraph we have to do the following
1. Importing the PyQtgraph module
2. Creating a plot window
3. Create or get the plotting data i.e horizontal and vertical data
4. Create a BarGraphItem object to plot the bar graph between the data
5. Append the BarGraphItem object to the plot window
下面是实现
# importing pyqtgraph as pg
import pyqtgraph as pg
# importing QtCore and QtGui from
# the pyqtgraph module
from pyqtgraph.Qt import QtCore, QtGui
# importing numpy as np
import numpy as np
import time
# creating a pyqtgraph plot window
window = pg.plot()
# setting window geometry
# left = 100, top = 100
# width = 600, height = 500
window.setGeometry(100, 100, 600, 500)
# title for the plot window
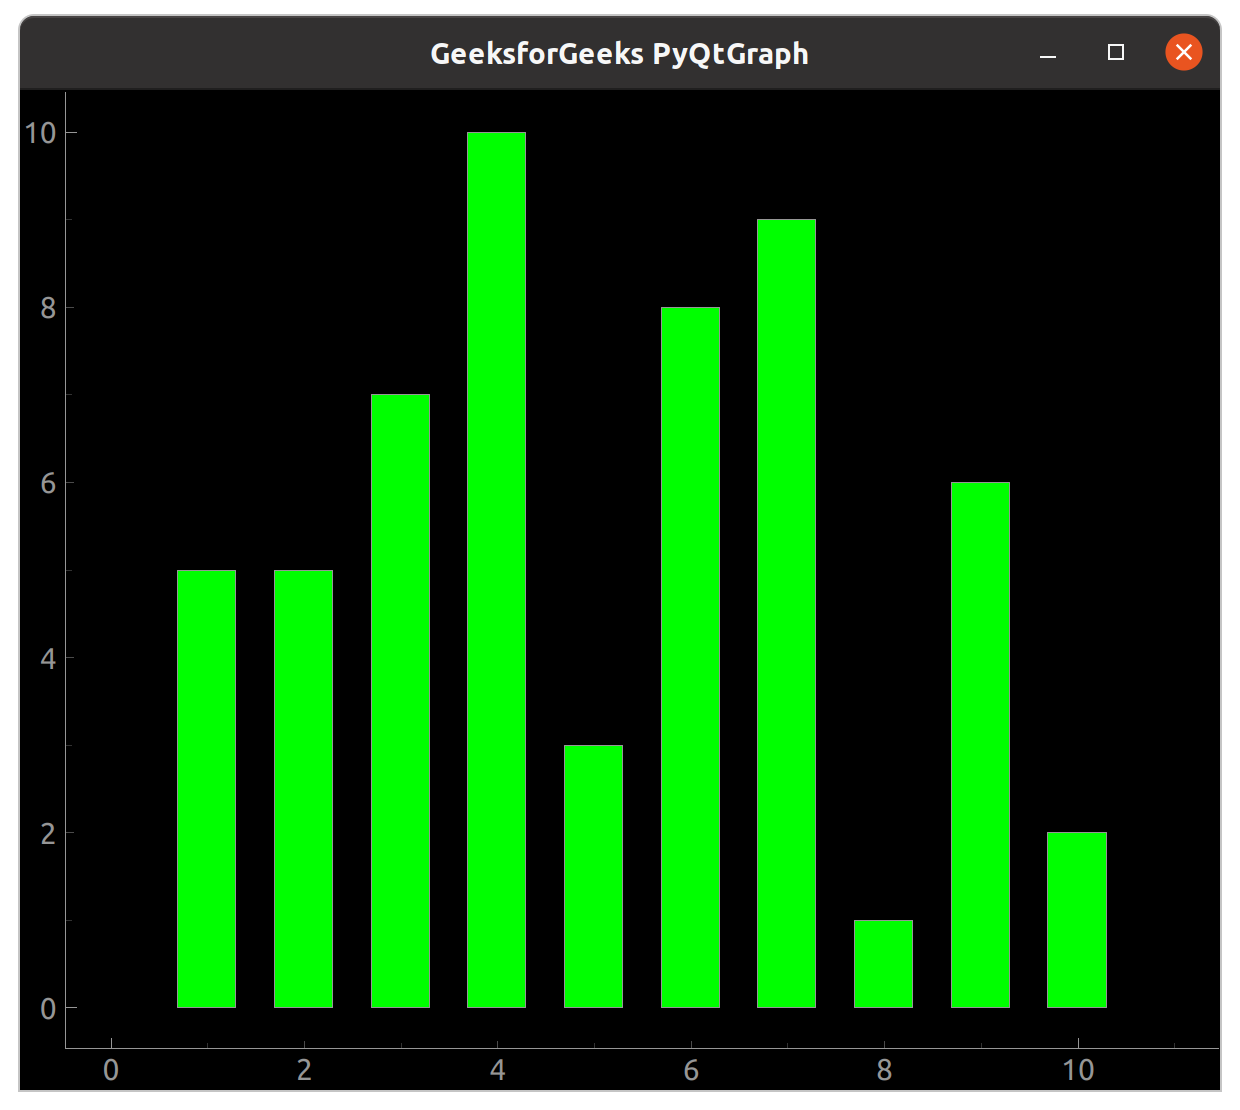
title = "GeeksforGeeks PyQtGraph"
# setting window title to plot window
window.setWindowTitle(title)
# create list for y-axis
y1 = [5, 5, 7, 10, 3, 8, 9, 1, 6, 2]
# create horizontal list i.e x-axis
x = [1, 2, 3, 4, 5, 6, 7, 8, 9, 10]
# create pyqt5graph bar graph item
# with width = 0.6
# with bar colors = green
bargraph = pg.BarGraphItem(x = x, height = y1, width = 0.6, brush ='g')
# add item to plot window
# adding bargraph item to the window
window.addItem(bargraph)
# main method
if __name__ == '__main__':
# importing system
import sys
# Start Qt event loop unless running in interactive mode or using
if (sys.flags.interactive != 1) or not hasattr(QtCore, 'PYQT_VERSION'):
QtGui.QApplication.instance().exec_()
输出 :