PyQtGraph - 获取条形图的位置
在本文中,我们将看到如何在 PyQtGraph 模块中获取条形图的位置。 PyQtGraph 是一个用于Python的图形和用户界面库,它提供了设计和科学应用程序中通常需要的功能。它的主要目标是提供用于显示数据(绘图、视频等)的快速交互式图形,其次是提供帮助快速应用程序开发的工具(例如,Qt Designer 中使用的属性树)。条形图或条形图是一种图表或图形,它用矩形条显示分类数据,矩形条的高度或长度与其所代表的值成正比。条形可以垂直或水平绘制。垂直条形图有时也称为柱形图。条形图的默认位置是 0, 0 即它从原点开始,尽管我们可以在 setPos 方法的帮助下随时更改此位置。
我们可以在下面给出的命令的帮助下创建一个绘图窗口和条形图
# creating a pyqtgraph plot window
window = pg.plot()

# creating a bar graph of green color
bargraph = pg.BarGraphItem(x=x, height=y1, width=0.6, brush='g')
In order to do this we use pos method with the bar graph object
Syntax : bargraph.pos()
Argument : It takes no argument
Return : It returns QPoint object
下面是实现
Python3
# importing QtGui to use QIcon
from PyQt5.QtGui import * from PyQt5.QtCore import Qt

# importing pyqtgraph as pg
import pyqtgraph as pg

# importing QtCore and QtGui from the pyqtgraph module
from pyqtgraph.Qt import QtCore, QtGui

# importing numpy as np
import numpy as np

import time

# creating a pyqtgraph plot window
window = pg.plot()

# icon for plot window
icon = QIcon("logo.png")

# setting icon to the plot window
window.setWindowIcon(icon)

# setting window geometry
# left = 100, top = 100
# width = 600, height = 500
window.setGeometry(100, 100, 600, 500)

# title for the plot window
title = "GeeksforGeeks PyQtGraph"

# setting window title to plot window
window.setWindowTitle(title)

# create list for y-axis
y1 = [5, 5, 7, 10, 3, 8, 9, 1, 6, 2]

# create horizontal list i.e x-axis
x = [1, 2, 3, 4, 5, 6, 7, 8, 9, 10]

# create pyqt5graph bar graph item
# with width = 0.6
# with bar colors = green
bargraph = pg.BarGraphItem(x = x, height = y1, width = 0.6, brush ='g')

# add item to plot window
# adding bargraph item to the window
window.addItem(bargraph)

# setting position of the bar graph
bargraph.setPos(500, 200)

# getting position of the bar graph
value = bargraph.pos()

# printing the value
print("Bar Graph Position : " + str(value))


# main method
if __name__ == '__main__':

    # importing system
    import sys

    # Start Qt event loop unless running in interactive mode or using
    if (sys.flags.interactive != 1) or not hasattr(QtCore, 'PYQT_VERSION'):
        QtGui.QApplication.instance().exec_()
输出 :
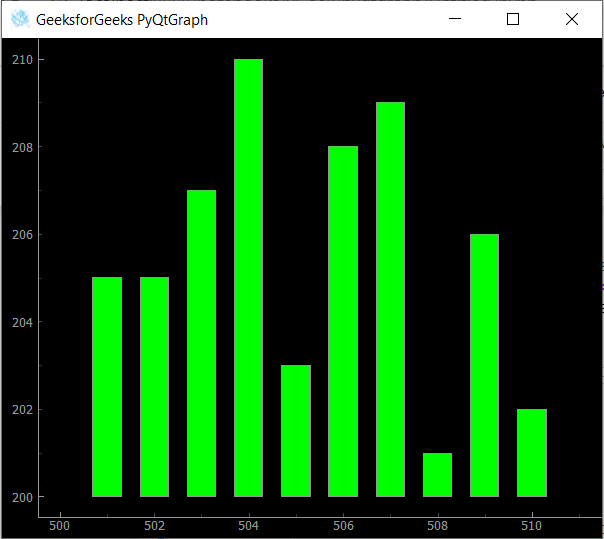
Bar Graph Position : Point(500.000000, 200.000000)