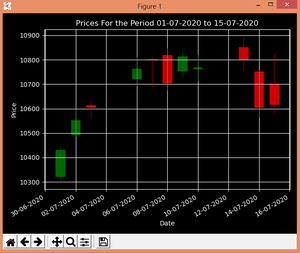
在Python中使用 mplfinance 模块绘制烛台图
烛台图也称为日本图表。这些被广泛用于交易中的技术分析,因为它们可以可视化一段时间内的价格大小。它们有四个点开、高、低、收( OHLC )。可以使用名为mplfinance的 matplotlib 模块在Python中创建烛台图。
安装:
pip install mplfinancemplfinance.candlestick_ohlc()
此函数用于绘制烛台图。
Syntax: mplfinance.candlestick_ohlc(ax, quotes, width=0.2, colorup=’k’, colordown=’r’, alpha=1.0)
Parameters:
- ax: An Axes instance to plot to.
- quotes: sequence of (time, open, high, low, close, …) sequences.
- width: Fraction of a day for the rectangle width.
- colorup: The color of the rectangle where close >= open.
- colordown: The color of the rectangle where close < open.
- alpha: (float) The rectangle alpha level.
Returns: returns (lines, patches) where lines are a list of lines added and patches is a list of the rectangle patches added.
为了绘制图表,我们将从 NSE 获取 01-07-2020 至 15-07-2020 期间的数据,数据可在 csv 文件中下载,也可以从此处下载。对于此示例,它保存为“data.csv”。
我们将使用 pandas 库从 data.csv 中提取用于绘图的数据。
下面是实现:
Python3
# import required packages
import matplotlib.pyplot as plt
from mplfinance import candlestick_ohlc
import pandas as pd
import matplotlib.dates as mpdates

plt.style.use('dark_background')

# extracting Data for plotting
df = pd.read_csv('data.csv')
df = df[['Date', 'Open', 'High',
         'Low', 'Close']]

# convert into datetime object
df['Date'] = pd.to_datetime(df['Date'])

# apply map function
df['Date'] = df['Date'].map(mpdates.date2num)

# creating Subplots
fig, ax = plt.subplots()

# plotting the data
candlestick_ohlc(ax, df.values, width = 0.6,
                 colorup = 'green', colordown = 'red',
                 alpha = 0.8)

# allow grid
ax.grid(True)

# Setting labels
ax.set_xlabel('Date')
ax.set_ylabel('Price')

# setting title
plt.title('Prices For the Period 01-07-2020 to 15-07-2020')

# Formatting Date
date_format = mpdates.DateFormatter('%d-%m-%Y')
ax.xaxis.set_major_formatter(date_format)
fig.autofmt_xdate()

fig.tight_layout()

# show the plot
plt.show()
输出 :

烛台图