使用 Matplotlib 增加线条的粗细
先决条件: Matplotlib
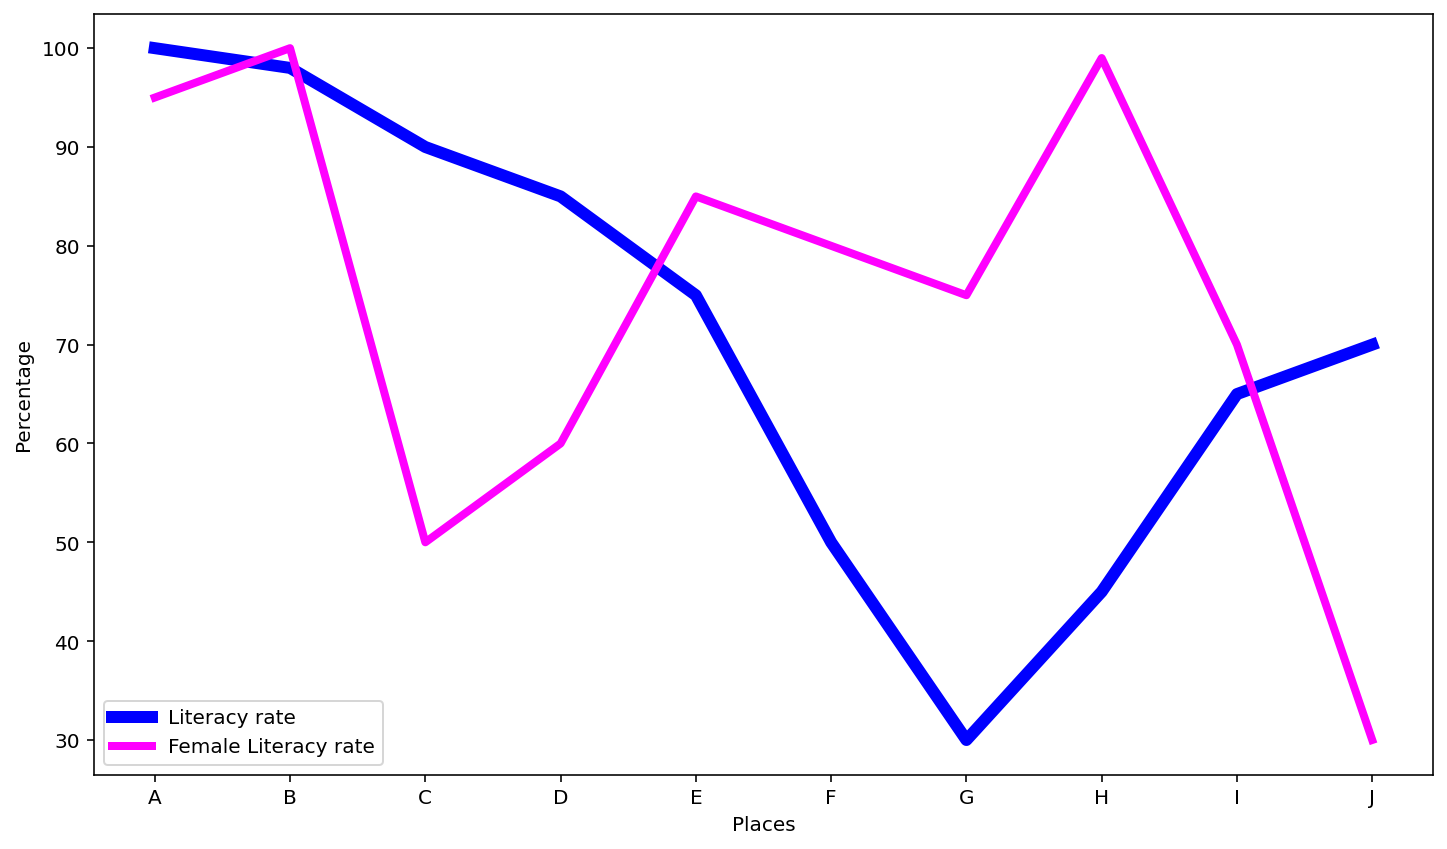
Matplotlib 是使用最广泛的库,用于使用可用数据集绘制图形。 Matplotlib 支持折线图,用于表示连续时间跨度内的数据。在折线图中,数据值被绘制为点,然后由一条线连接以显示度量随时间的趋势。增加线条粗细的功能由 linewidth 属性给出。
线宽:默认情况下,线宽为 1。对于具有多条线的图形,很难用较浅的颜色来追踪线条。这种情况可以通过增加线宽来处理。与其他数据相比,线宽可用于关注某些数据。它可以帮助获得数据集中特定记录的详细可视化。该属性属于绘图函数()。
方法
- 导入模块
- 创建或加载数据
- 绘制具有所需线条粗细的图形
- 显示图
使用的功能
- xlabel()-该函数用于设置 x 轴的标签
Syntax: plt.xlabel(xlabel, fontdict=None, labelpad=None, **kwargs)
Parameter:
- xlabel: accepts string type value and is used to label the X axis.
- fontdict: used to override default font properties of the label. Its default value is None and is optional.
- labelpad: default value is None. It is used to specify the spacing of the label from the axes. This is optional.
- **kwargs: used to specify other properties that can be used to modify the appearance of the label.
- ylabel()-这个函数用来设置y轴的标签
Syntax: plt.ylabel(ylabel, fontdict=None, labelpad=None, **kwargs)
Parameter:
- ylabel: accepts string type value and is used to label the Y axis.
- fontdict: used to override default font properties of the label. Its default value is None and is optional.
- labelpad: default value is None. It is used to specify the spacing of the label from the axes. This is optional.
- **kwargs: used to specify other properties that can be used to modify the appearance of the label.
- plot()-用于制作点 x, y 的 2D 六边形分箱图。
Syntax: plt.plot(x,y, data=None, **kwargs)
Parameter
- x,y : used to specify the data to be plotted along the x and y axis.
- data: default value is None. It is an object with labelled data and can be passed instead of the x,y values. If data object is passed then the xand y label should be specified.
- **kwargs: used to specify line properties like linewidth, color, antialiasing, marker, markercolor etc.
- 图例()-图例是描述图形元素的区域。在 matplotlib 库中,有一个名为 legend() 的函数,用于在轴上放置图例。
Syntax: plt.legend(**options)
Parameter
**options: used to specify the properties of the legend, its size, its location, edgecolor, facecolor etc
示例 1:
Python3
import matplotlib.pyplot as plt

places = ["A", "B", "C", "D", "E", "F", "G", "H", "I", "J"]
literacy_rate = [100, 98, 90, 85, 75, 50, 30, 45, 65, 70]
female_literacy = [95, 100, 50, 60, 85, 80, 75, 99, 70, 30]

plt.xlabel("Places")
plt.ylabel("Percentage")

plt.plot(places, literacy_rate, color='blue',
         linewidth=6, label="Literacy rate")

plt.plot(places, female_literacy, color='fuchsia',
         linewidth=4, label="Female Literacy rate")

plt.legend(loc='lower left', ncol=1)
Python3
import matplotlib.pyplot as plt

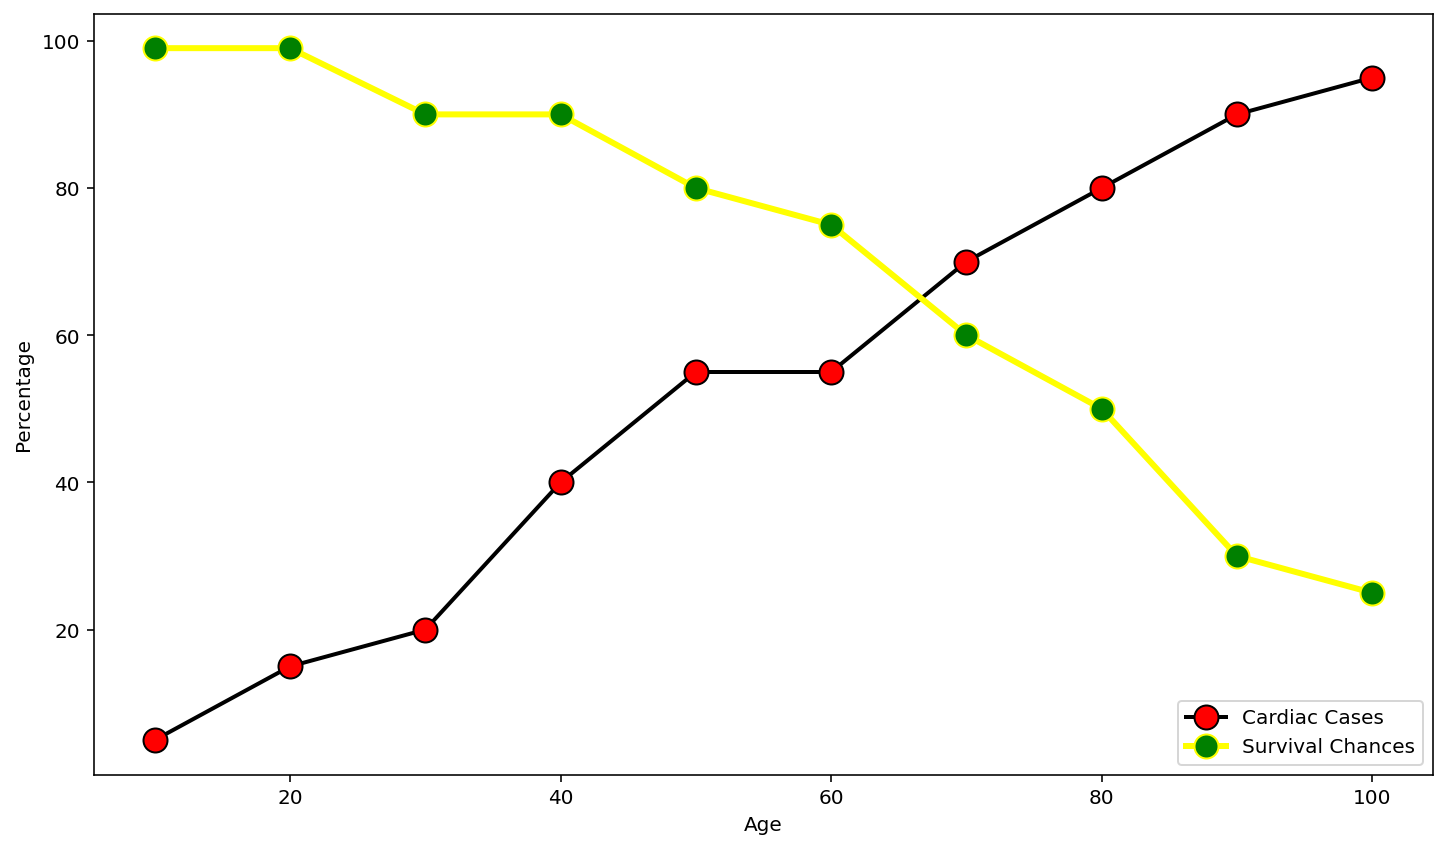
age = [10, 20, 30, 40, 50, 60, 70, 80, 90, 100]
cardiac_cases = [5, 15, 20, 40, 55, 55, 70, 80, 90, 95]
survival_chances = [99, 99, 90, 90, 80, 75, 60, 50, 30, 25]

plt.xlabel("Age")
plt.ylabel("Percentage")

plt.plot(age, cardiac_cases, color='black', linewidth=2,
         label="Cardiac Cases", marker='o', markerfacecolor='red', markersize=12)

plt.plot(age, survival_chances, color='yellow', linewidth=3,
         label="Survival Chances", marker='o', markerfacecolor='green', markersize=12)

plt.legend(loc='lower right', ncol=1)
输出

示例 2:
蟒蛇3
import matplotlib.pyplot as plt

age = [10, 20, 30, 40, 50, 60, 70, 80, 90, 100]
cardiac_cases = [5, 15, 20, 40, 55, 55, 70, 80, 90, 95]
survival_chances = [99, 99, 90, 90, 80, 75, 60, 50, 30, 25]

plt.xlabel("Age")
plt.ylabel("Percentage")

plt.plot(age, cardiac_cases, color='black', linewidth=2,
         label="Cardiac Cases", marker='o', markerfacecolor='red', markersize=12)

plt.plot(age, survival_chances, color='yellow', linewidth=3,
         label="Survival Chances", marker='o', markerfacecolor='green', markersize=12)

plt.legend(loc='lower right', ncol=1)
输出
