将粗体和斜体文本添加到 R 中的 ggplot2 Plot
在本文中,我们将讨论如何使用 R 编程语言中的 ggplot2 将粗体和斜体文本添加到绘图中。
要添加粗体和斜体文本,我们将使用 R 语言 ggplot2 库中的annotate()函数,该函数有助于将文本添加到 ggplot2 图中具有不同变化的图形中。
安装 ggplot2 库:
install.packages("ggplot2")要导入/加载 ggplot2 库:
library("ggplot2") 注释函数:此函数将几何图形添加到绘图中,几何图形的属性不是从数据框的变量映射的,而是作为向量传入的。这对于添加小注释或将数据放在向量中很有用,并且由于某种原因不想将它们放在数据框中。换句话说,它可以帮助用户将具有不同属性的文本添加到 ggplot2 图中。
Syntax: annotate(geom,x = NULL,y = NULL,xmin = NULL,xmax = NULL,ymin = NULL,max = NULL,xend = NULL,yend = NULL,…,label Fontface,na.rm = FALSE)
Parameters:-
- geom:-name of geom to use for annotation
- x, y, xmin, ymin, xmax, ymax, xend, yend:-positioning aesthetics – you must specify at least one of these.
- label:-a character string containing a variable’s label
- Fontface:- The font face
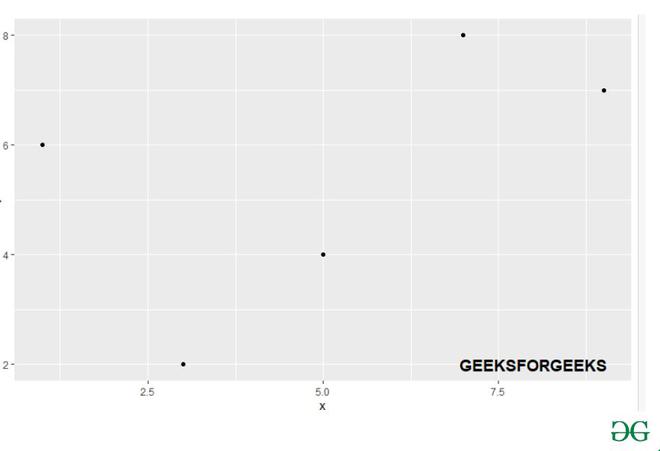
示例 1:向 ggplot2 绘图添加粗体文本。
在这个例子中,首先我们将创建一个包含 5 个元素的数据框,并在 ggplot2 库中的 ggplot()函数的帮助下绘制它。然后使用 annotate()函数并在字体中传递粗体参数,我们将为它添加粗体文本。
代码:
R
# Load ggplot2 package
library("ggplot2")
gfg_data=data.frame(x = c( 7, 5, 1, 3, 9),
                    y = c(8, 4, 6, 2, 7));

gfg_plot <- ggplot(gfg_data, aes(x, y)) +geom_point()
gfg_plot +annotate("text", x =8, y = 2, size = 5,
           label = "GEEKSFORGEEKS",
           fontface = "bold")
R
library("ggplot2")
gfg_data = data.frame(x = c(7, 5, 1, 3, 9),
                    y = c(8, 4, 6, 2, 7));

gfg_plot <- ggplot(gfg_data, aes(x, y)) +geom_point()
gfg_plot +annotate("text", x = 8, y = 2, size = 5,
           label = "GEEKSFORGEEKS",
           fontface = "italic")
输出:

示例 2:向 ggplot2 Plot 添加斜体文本。
在这个例子中,首先我们将创建一个包含 10 个元素的数据框,并在 ggplot2 库中的 ggplot()函数的帮助下绘制它。然后使用 annotate()函数并在 fontface 中传递斜体参数,我们将向其添加斜体文本。
电阻
library("ggplot2")
gfg_data = data.frame(x = c(7, 5, 1, 3, 9),
                    y = c(8, 4, 6, 2, 7));

gfg_plot <- ggplot(gfg_data, aes(x, y)) +geom_point()
gfg_plot +annotate("text", x = 8, y = 2, size = 5,
           label = "GEEKSFORGEEKS",
           fontface = "italic")
输出:
