在 Matplotlib 中定位颜色条
Matplotlib 是Python编程语言中的绘图库,默认情况下它是Python语言中 NumPy 库的数值数学扩展。在使用Python语言编程时,我们使用 matplotlib 库包进行图形和直方图可视化。但是在Python中使用 matplotlib 绘制直方图时,相邻条之间缺少分隔或空间。这使得直方图使用起来非常繁琐,并且变得非常难以解释。在本文中,我们将看到 Matplotlib 中颜色条的定位。
matplotlib 的 pyplot 模块中的colorbar()函数将颜色条添加到指示色标的绘图中。
Syntax: matplotlib.pyplot.colorbar(mappable=None, cax=None, ax=None, **kwarg)
Parameters:
- ax: This parameter is an optional parameter and it contains Axes or list of Axes.
- **kwarg (keyword arguments): This parameter is an optional parameter and are of two kinds:
Returns: colorbar which is an instance of the class ‘matplotlib.colorbar.Colorbar’.
方法:
- 导入所需的模块。
- 为两个坐标准备数据点。
- 用 pyplot 绘制图表。
- 使用具有合适值的适当关键字使用 pyplot.colorbar 定位颜色条
- 显示图
示例 1:在绘图右侧添加颜色条。
在这个例子中,我们将绘制一个具有不同数据点的散点图,然后使用颜色条方法在图表的右侧放置一个颜色条。默认情况下,颜色栏出现在右侧。
Python3
import matplotlib.pyplot as plt

x = [5, 7, 8, 7, 2, 17, 2, 9,
     4, 11, 12, 9, 6]

y = [99, 86, 87, 88, 100, 86,
     103, 87, 94, 78, 77, 85, 86]

plt.scatter(x, y, c="blue")

# Plot colorbar
plt.colorbar(label="Color Ratio")

# To show the plot
plt.show()
Python3
import matplotlib.pyplot as plt

x = [5, 7, 8, 7, 2, 17, 2, 9,
     4, 11, 12, 9, 6]

y = [99, 86, 87, 88, 100, 86,
     103, 87, 94, 78, 77, 85, 86]

plt.scatter(x, y, c="blue")

# Plot horizontal colorbar
plt.colorbar(label="Color Ratio",
             orientation="horizontal")

# To show the plot
plt.show()
Python3
import matplotlib.pyplot as plt
import numpy as np

array = np.arange(70, 0, -1).reshape(7, 10)
fig, ax = plt.subplots()

# This is the position for the colorbar
cbaxes = fig.add_axes([0.09, 0.12, 0.02, 0.7])

im = ax.imshow(array, cmap='afmhot_r')
plt.colorbar(im, cax=cbaxes)

# To show the plot
plt.show()
Python
import numpy as np
import matplotlib.pyplot as plt

data = np.arange(100, 0, -1).reshape(10, 10)

fig, ax = plt.subplots()
cbaxes = fig.add_axes([0.28, 0.9, 0.49, 0.03])

im = ax.imshow(data, cmap='afmhot_r')

fig.colorbar(im, cax=cbaxes, orientation='horizontal')

plt.show()
输出:

示例 2:在绘图下方添加颜色条。
在本例中,我们将绘制具有不同数据点的散点图,然后使用颜色条方法在图表下方放置一个颜色条。为此,需要为其方向关键字赋予“水平”值。
蟒蛇3
import matplotlib.pyplot as plt

x = [5, 7, 8, 7, 2, 17, 2, 9,
     4, 11, 12, 9, 6]

y = [99, 86, 87, 88, 100, 86,
     103, 87, 94, 78, 77, 85, 86]

plt.scatter(x, y, c="blue")

# Plot horizontal colorbar
plt.colorbar(label="Color Ratio",
             orientation="horizontal")

# To show the plot
plt.show()
输出:

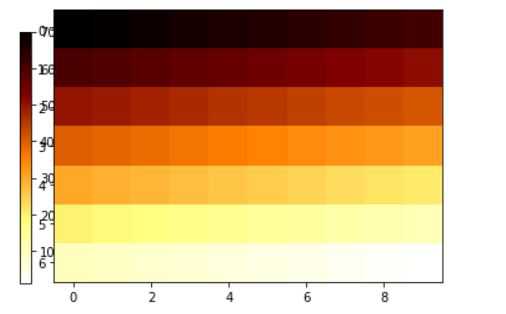
示例 3:向左侧添加颜色条
在这个例子中,我们将用不同的数据点绘制 a,然后使用带有 cax 属性的颜色条方法在图表的左侧放置一个颜色条。通常, cax 用于绘图 带有轴(坐标)的图表,将在其中绘制颜色条。
蟒蛇3
import matplotlib.pyplot as plt
import numpy as np

array = np.arange(70, 0, -1).reshape(7, 10)
fig, ax = plt.subplots()

# This is the position for the colorbar
cbaxes = fig.add_axes([0.09, 0.12, 0.02, 0.7])

im = ax.imshow(array, cmap='afmhot_r')
plt.colorbar(im, cax=cbaxes)

# To show the plot
plt.show()
输出:

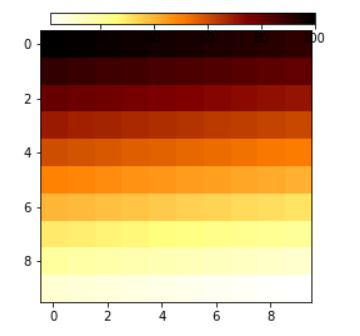
示例 4:在绘图顶部添加颜色条。
在这个例子中,我们将用不同的数据点绘制一个图,然后使用带有 cax 属性的颜色条方法在图表顶部放置一个颜色条。通常, cax 用于绘图 带有轴(坐标)的图表,将在其中绘制颜色条。
Python
import numpy as np
import matplotlib.pyplot as plt

data = np.arange(100, 0, -1).reshape(10, 10)

fig, ax = plt.subplots()
cbaxes = fig.add_axes([0.28, 0.9, 0.49, 0.03])

im = ax.imshow(data, cmap='afmhot_r')

fig.colorbar(im, cax=cbaxes, orientation='horizontal')

plt.show()
输出:
