在 Matplotlib 下显示两个颜色条
在本文中,我们将学习如何在 Matplotlib 下使用带有两个颜色条的 Imshow。让我们讨论一些概念:
- Matplotlib是一个出色的Python可视化库,用于数组的 2D 绘图。 Matplotlib 是一个基于 NumPy 数组的多平台数据可视化库,旨在与更广泛的 SciPy 堆栈一起使用。它是由 John Hunter 在 2002 年推出的。
- 可视化的最大好处之一是它允许我们以易于理解的视觉效果直观地访问大量数据。 Matplotlib 由几个图组成,如线、条、散点图、直方图等。
- matplotlib 库的pyplot 模块中的imshow()函数用于将数据显示为图像;即在二维常规光栅上。
- matplotlib 的 pyplot 模块中的colorbar()函数将颜色条添加到指示色标的绘图中。
带有一个颜色条的简单 Imshow()
Python3
# import libraries
import matplotlib.pyplot as plt
import numpy as np

# create image = 10x10 array
img = np.random.randint(-100, 100, (10, 10))

# make plot
fig, ax = plt.subplots()

# show image
shw = ax.imshow(img)

# make bar
bar = plt.colorbar(shw)

# show plot with labels
plt.xlabel('X Label')
plt.ylabel('Y Label')
bar.set_label('ColorBar')
plt.show()
Python3
# import libraries
import matplotlib.pyplot as plt
import numpy as np
from numpy.ma import masked_array

# create image = 10x10 array
img = np.random.randint(-100, 100, (10, 10))

# masked array to positive and negative values
neg_img = masked_array(img, img >= 0)
pos_img = masked_array(img, img < 0)

# make plot
fig, ax = plt.subplots()

# show image
shw1 = ax.imshow(neg_img, cmap=plt.cm.Reds)
shw2 = ax.imshow(pos_img, cmap=plt.cm.winter)

# make bars
bar1 = plt.colorbar(shw1)
bar2 = plt.colorbar(shw2)

# show plot with labels
plt.xlabel('X Label')
plt.ylabel('Y Label')
bar1.set_label('ColorBar 1')
bar2.set_label('ColorBar 2')
plt.show()
输出 :
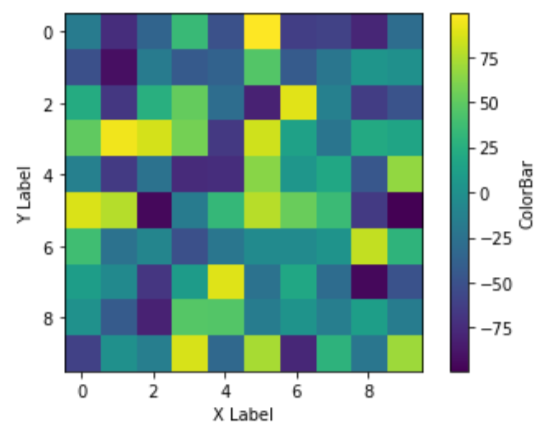
在上面的输出中,我们可以看到有一个颜色条,其值范围从 -100 到 100。这看起来并不有效,也没有清除小的正值与较大的正值的差异同样没有清除小的负值的差异更大的负值。在这里,我们将颜色条分为两部分:
- 一个具有正值的
- 一个负值
用不同的颜色,帮助我们清楚有效地理解情节。下面提到了此类工作的所有步骤。
所需步骤:
- 导入库(matplotlib)
- 创建/加载图像数据
- 屏蔽数组为正值和负值
- 使用 subplot() 方法绘图
- 使用 imshow() 方法显示图像
- 使用 matplotlib.pyplot.colorbar() 方法制作条形图
- 显示带标签的绘图
例子:
蟒蛇3
# import libraries
import matplotlib.pyplot as plt
import numpy as np
from numpy.ma import masked_array

# create image = 10x10 array
img = np.random.randint(-100, 100, (10, 10))

# masked array to positive and negative values
neg_img = masked_array(img, img >= 0)
pos_img = masked_array(img, img < 0)

# make plot
fig, ax = plt.subplots()

# show image
shw1 = ax.imshow(neg_img, cmap=plt.cm.Reds)
shw2 = ax.imshow(pos_img, cmap=plt.cm.winter)

# make bars
bar1 = plt.colorbar(shw1)
bar2 = plt.colorbar(shw2)

# show plot with labels
plt.xlabel('X Label')
plt.ylabel('Y Label')
bar1.set_label('ColorBar 1')
bar2.set_label('ColorBar 2')
plt.show()
输出 :
