验证曲线
验证曲线是一种重要的诊断工具,它显示了机器学习模型的准确性变化与模型的某些参数变化之间的敏感性。
通常在模型的某些参数和模型的分数之间绘制一条验证曲线。验证曲线中有两条曲线——一条用于训练集得分,一条用于交叉验证得分。默认情况下,scikit-learn 库中的验证曲线函数执行 3 折交叉验证。
验证曲线用于基于超参数评估现有模型,而不是用于调整模型。这是因为,如果我们根据验证分数调整模型,模型可能会偏向于模型调整所针对的特定数据;因此,不能很好地估计模型的泛化。
解释验证曲线
解释验证曲线的结果有时会很棘手。查看验证曲线时请记住以下几点:
- 理想情况下,我们希望验证曲线和训练曲线看起来尽可能相似。
- 如果两个分数都很低,则模型很可能拟合不足。这意味着要么模型太简单,要么它的特征太少。也可能是模型过于规范化的情况。
- 如果训练曲线相对较快地达到高分而验证曲线滞后,则模型过度拟合。这意味着模型非常复杂,数据太少;或者它可能仅仅意味着数据太少。
- 我们想要训练曲线和验证曲线彼此最接近的参数值。
Python中验证曲线的实现:
为简单起见,在此示例中,我们将使用非常流行的“数字”数据集。有关此数据集的更多信息,请参见以下链接:
https://scikit-learn.org/stable/auto_examples/datasets/plot_digits_last_image
对于这个例子,我们将使用 k-Nearest Neighbor 分类器,并将模型在训练集得分和交叉验证得分上的准确度与“k”值(即要考虑的邻居数)进行对比。
代码:实现 5 折交叉验证并测试 'k' 从 1 到 10 的值的Python代码。
python3
# Import Required libraries
import matplotlib.pyplot as plt
import numpy as np
from sklearn.datasets import load_digits
from sklearn.neighbors import KNeighborsClassifier
from sklearn.model_selection import validation_curve

# Loading dataset
dataset = load_digits()

# X contains the data and y contains the labels
X, y = dataset.data, dataset.target

# Setting the range for the parameter (from 1 to 10)
parameter_range = np.arange(1, 10, 1)

# Calculate accuracy on training and test set using the
# gamma parameter with 5-fold cross validation
train_score, test_score = validation_curve(KNeighborsClassifier(), X, y,
                                       param_name = "n_neighbors",
                                       param_range = parameter_range,
                                        cv = 5, scoring = "accuracy")

# Calculating mean and standard deviation of training score
mean_train_score = np.mean(train_score, axis = 1)
std_train_score = np.std(train_score, axis = 1)

# Calculating mean and standard deviation of testing score
mean_test_score = np.mean(test_score, axis = 1)
std_test_score = np.std(test_score, axis = 1)

# Plot mean accuracy scores for training and testing scores
plt.plot(parameter_range, mean_train_score,
     label = "Training Score", color = 'b')
plt.plot(parameter_range, mean_test_score,
   label = "Cross Validation Score", color = 'g')

# Creating the plot
plt.title("Validation Curve with KNN Classifier")
plt.xlabel("Number of Neighbours")
plt.ylabel("Accuracy")
plt.tight_layout()
plt.legend(loc = 'best')
plt.show()
输出:
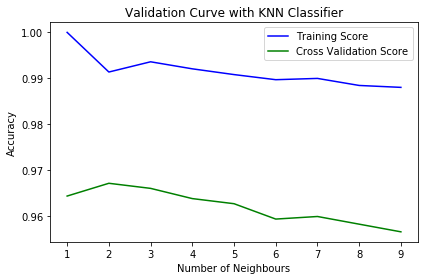
从该图中,我们可以观察到“k”=2将是 k 的理想值。随着邻居数量 (k) 的增加,训练分数的准确性以及交叉验证分数都会降低。