Matplotlib – 动画多行
在本文中,我们将学习如何使用 matplotlib 制作多行动画图表。动画图表可以使事情更具吸引力,还可以帮助其他人更恰当地可视化数据,而不是静态图表。当我们处理描述时间序列数据的项目(股票市场、ECG 异常检测、互联网流量预测)时,动画更有意义。
matplotlib.animation.FuncAnimation类用于递归调用动画。您必须将创建的动画存储在一个变量中,该变量在动画运行期间一直存在。否则,Animation 对象将被垃圾收集并停止动画。
Syntax: class matplotlib.animation.FuncAnimation(fig, func, frames=None, init_func=None, fargs=None, save_count=None, *, cache_frame_data=True, **kwargs)
示例 1:
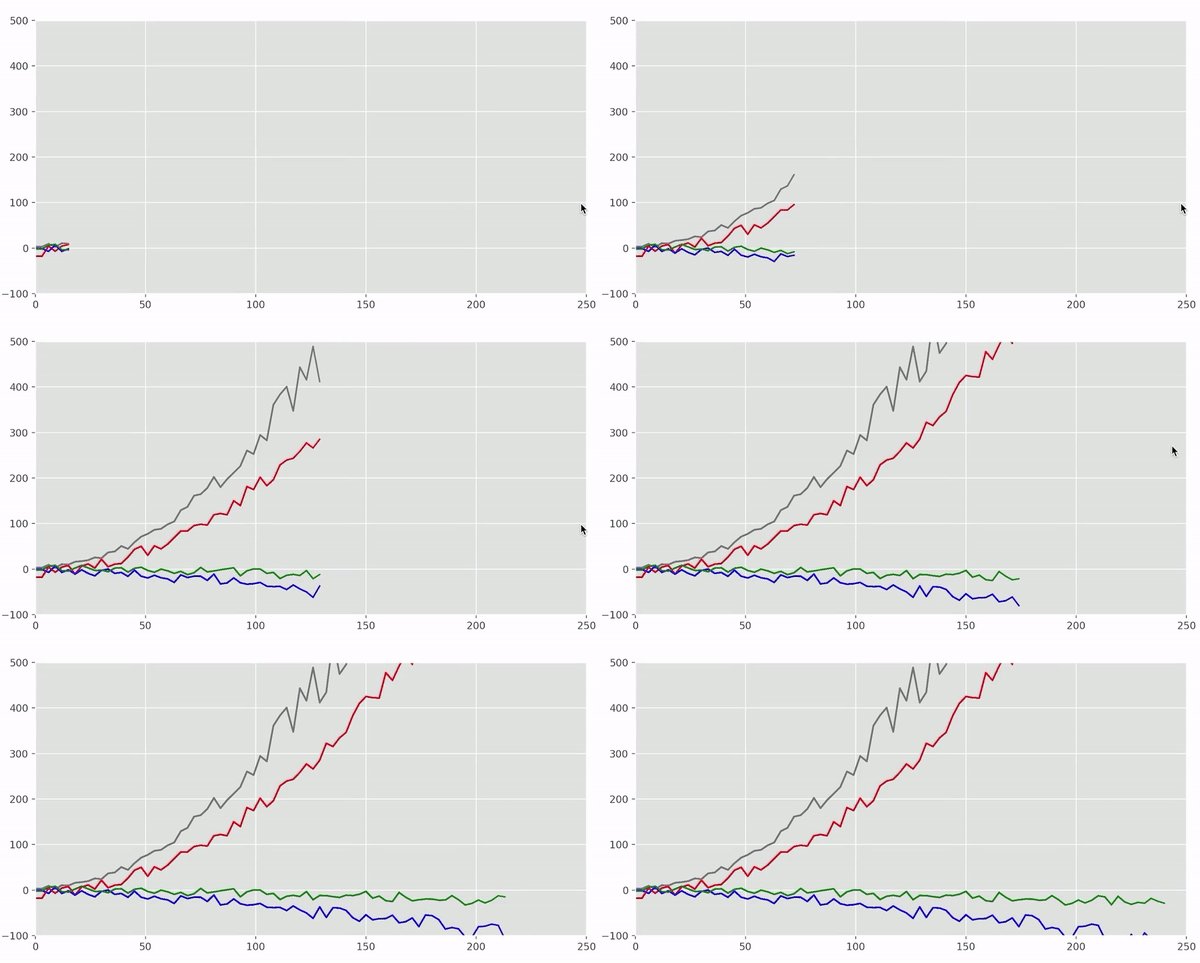
对于 matplotlib,我们主要需要两个重要的模块:pyplot 和动画(Funcanimation)。下面是有关如何在 matplotlib 中为线条设置动画的分步方法。我们将使用一定范围内的随机数来制作我们的第一个示例,其中包含 4 个手动构建的图。
- 导入创建图表和动画所需的所有库。
Python3
# importing all necessary libraries
import random
import matplotlib
from matplotlib import animation
import matplotlib.pyplot as plt
from matplotlib.animation import FuncAnimation
%matplotlib qt
Python3
# add random points for each line
l1 = [random.randint(-20, 4)+(points**1.88)/(random.randint(13, 14))
      for points in range(0, 160, 2)]
l2 = [random.randint(0, 9)+(points**1.9)/(random.randint(9, 11))
      for points in range(0, 160, 2)]
l3 = [random.randint(-10, 10)-(points**1.4)/(random.randint(9, 12))
      for points in range(0, 160, 2)]
l4 = [random.randint(-5, 10)-(points**1.1)/(random.randint(7, 12))
      for points in range(0, 160, 2)]
Python3
from itertools import count
myvar = count(0, 3)
Python3
# subplots() function you can draw
# multiple plots in one figure
fig, axes = plt.subplots(nrows=1, ncols=1, figsize=(10, 5))

# set limit for x and y axis
axes.set_ylim(-100, 500)
axes.set_xlim(0, 250)

# style for plotting line
plt.style.use("ggplot")

# create 5 list to get store element
# after every iteration
x1, y1, y2, y3, y4 = [], [], [], [], []
myvar = count(0, 3)

def animate(i):
    x1.append(next(myvar))
    y1.append((l1[i]))
    y2.append((l2[i]))
    y3.append((l3[i]))
    y4.append((l4[i]))

    axes.plot(x1, y1, color="red")
    axes.plot(x1, y2, color="gray")
    axes.plot(x1, y3, color="blue")
    axes.plot(x1, y4, color="green")


# set ani variable to call the
# function recursively
anim = FuncAnimation(fig, animate, interval=30)
Python3
# importing all necessary libraries
from itertools import count
import random
import matplotlib
from matplotlib import animation
import matplotlib.pyplot as plt
from matplotlib.animation import FuncAnimation
%matplotlib qt

# add random points for each line
l1 = [random.randint(-20, 4)+(points**1.88)/(random.randint(13, 14))
      for points in range(0, 160, 2)]
l2 = [random.randint(0, 9)+(points**1.9)/(random.randint(9, 11))
      for points in range(0, 160, 2)]
l3 = [random.randint(-10, 10)-(points**1.4)/(random.randint(9, 12))
      for points in range(0, 160, 2)]
l4 = [random.randint(-5, 10)-(points**1.1)/(random.randint(7, 12))
      for points in range(0, 160, 2)]

myvar = count(0, 3)

# subplots() function you can draw
# multiple plots in one figure
fig, axes = plt.subplots(nrows=1, ncols=1, figsize=(10, 5))

# set limit for x and y axis
axes.set_ylim(-100, 500)
axes.set_xlim(0, 250)

# style for plotting line
plt.style.use("ggplot")

# create 5 list to get store element
# after every iteration
x1, y1, y2, y3, y4 = [], [], [], [], []
myvar = count(0, 3)

def animate(i):
    x1.append(next(myvar))
    y1.append((l1[i]))
    y2.append((l2[i]))
    y3.append((l3[i]))
    y4.append((l4[i]))

    axes.plot(x1, y1, color="red")
    axes.plot(x1, y2, color="gray")
    axes.plot(x1, y3, color="blue")
    axes.plot(x1, y4, color="green")


# set ani variable to call the
# function recursively
anim = FuncAnimation(fig, animate, interval=30)
Python3
# import modules
import numpy as np
import matplotlib
import matplotlib.pyplot as plt
import matplotlib.animation as animation
Python3
def updateline(num, data, line1, data2, line2):
    line1.set_data(data[..., :num])
    line2.set_data(data2[..., :num])

    time_text.set_text("Points: %.0f" % int(num))

    return line1, line2


# generating data of 100 elements
# each for line 1
x = np.linspace(0, 2*np.pi, 100)
y = np.sin(x)
data = np.array([x, y])

# generating data of 100 elements
# each for line 2
x2 = np.linspace(0, 2*np.pi, 100)
y2 = np.cos(x2)
data2 = np.array([x2, y2])

# setup the formating for moving files
Writer = animation.writers['ffmpeg']
Writer = Writer(fps=10, metadata=dict(artist="Me"), bitrate=-1)


fig = plt.figure()
ax = fig.add_subplot(111)
l, = ax.plot([], [], 'r-', label="Sin")
ax2 = ax.twinx()
k = ax2.plot([], [], 'b-', label="Cos")[0]

ax.legend([l, k], [l.get_label(), k.get_label()], loc=0)

ax.set_xlabel("X")

# axis 1
ax.set_ylim(-1.5, 1.5)
ax.set_xlim(0, 7)

# axis 2
ax2.set_ylim(-1.5, 1.5)
ax2.set_xlim(0, 7)

plt.title('Sin and Cos')
time_text = ax.text(0.1, 0.95, "", transform=ax.transAxes,
                    fontsize=15, color='red')
Python3
# set line_animation variable to call
# the function recursively
line_animation = animation.FuncAnimation(
    fig, updateline, frames=100, fargs=(data, l, data2, k))

line_animation.save("lines.mp4", writer=Writer)
Python3
# import required modules
import numpy as np
import matplotlib
import matplotlib.pyplot as plt
import matplotlib.animation as animation


def updateline(num, data, line1, data2, line2):
    line1.set_data(data[..., :num])
    line2.set_data(data2[..., :num])

    time_text.set_text("Points: %.0f" % int(num))

    return line1, line2


# generating data of 100 elements
# each for line 1
x = np.linspace(0, 2*np.pi, 100)
y = np.sin(x)
data = np.array([x, y])

# generating data of 100 elements
# each for line 2
x2 = np.linspace(0, 2*np.pi, 100)
y2 = np.cos(x2)
data2 = np.array([x2, y2])

# setup the formating for moving files
Writer = animation.writers['ffmpeg']
Writer = Writer(fps=10, metadata=dict(artist="Me"), bitrate=-1)


fig = plt.figure()
ax = fig.add_subplot(111)
l, = ax.plot([], [], 'r-', label="Sin")
ax2 = ax.twinx()
k = ax2.plot([], [], 'b-', label="Cos")[0]

ax.legend([l, k], [l.get_label(), k.get_label()], loc=0)

ax.set_xlabel("X")

# axis 1
ax.set_ylim(-1.5, 1.5)
ax.set_xlim(0, 7)

# axis 2
ax2.set_ylim(-1.5, 1.5)
ax2.set_xlim(0, 7)

plt.title('Sin and Cos')
time_text = ax.text(0.1, 0.95, "", transform=ax.transAxes,
                    fontsize=15, color='red')

# set line_animation variable to call
# the function recursively
line_animation = animation.FuncAnimation(
    fig, updateline, frames=100, fargs=(data, l, data2, k))
line_animation.save("lines.mp4", writer=Writer)- 现在制作 4 组不同的 y,即 y1,y2,y3,y4,它们将共享相同的 x 轴值。在取随机值时,我们将除以每个随机值,因为这将帮助我们获得不同的指数线。
蟒蛇3
# add random points for each line
l1 = [random.randint(-20, 4)+(points**1.88)/(random.randint(13, 14))
      for points in range(0, 160, 2)]
l2 = [random.randint(0, 9)+(points**1.9)/(random.randint(9, 11))
      for points in range(0, 160, 2)]
l3 = [random.randint(-10, 10)-(points**1.4)/(random.randint(9, 12))
      for points in range(0, 160, 2)]
l4 = [random.randint(-5, 10)-(points**1.1)/(random.randint(7, 12))
      for points in range(0, 160, 2)]
- 现在使用 itertools 进行迭代。该模块运行速度快,它是一种内存高效的工具,可单独使用或组合使用以形成迭代器代数。您也可以使用 for 循环来迭代只创建一个列表并开始存储 y wrt x 的变量。
蟒蛇3
from itertools import count
myvar = count(0, 3)
- 当我们包含 x1 和 y1 时,为新行(y2、y3 和 y4)创建 3 个额外的空列表,总共 5 个空列表。在动画函数,我们将在每个迭代步骤填充这些容器。在每次迭代单帧创建动画。此外,为 4 条不同的线添加颜色。
蟒蛇3
# subplots() function you can draw
# multiple plots in one figure
fig, axes = plt.subplots(nrows=1, ncols=1, figsize=(10, 5))

# set limit for x and y axis
axes.set_ylim(-100, 500)
axes.set_xlim(0, 250)

# style for plotting line
plt.style.use("ggplot")

# create 5 list to get store element
# after every iteration
x1, y1, y2, y3, y4 = [], [], [], [], []
myvar = count(0, 3)

def animate(i):
    x1.append(next(myvar))
    y1.append((l1[i]))
    y2.append((l2[i]))
    y3.append((l3[i]))
    y4.append((l4[i]))

    axes.plot(x1, y1, color="red")
    axes.plot(x1, y2, color="gray")
    axes.plot(x1, y3, color="blue")
    axes.plot(x1, y4, color="green")


# set ani variable to call the
# function recursively
anim = FuncAnimation(fig, animate, interval=30)
下面是完整的程序:
蟒蛇3
# importing all necessary libraries
from itertools import count
import random
import matplotlib
from matplotlib import animation
import matplotlib.pyplot as plt
from matplotlib.animation import FuncAnimation
%matplotlib qt

# add random points for each line
l1 = [random.randint(-20, 4)+(points**1.88)/(random.randint(13, 14))
      for points in range(0, 160, 2)]
l2 = [random.randint(0, 9)+(points**1.9)/(random.randint(9, 11))
      for points in range(0, 160, 2)]
l3 = [random.randint(-10, 10)-(points**1.4)/(random.randint(9, 12))
      for points in range(0, 160, 2)]
l4 = [random.randint(-5, 10)-(points**1.1)/(random.randint(7, 12))
      for points in range(0, 160, 2)]

myvar = count(0, 3)

# subplots() function you can draw
# multiple plots in one figure
fig, axes = plt.subplots(nrows=1, ncols=1, figsize=(10, 5))

# set limit for x and y axis
axes.set_ylim(-100, 500)
axes.set_xlim(0, 250)

# style for plotting line
plt.style.use("ggplot")

# create 5 list to get store element
# after every iteration
x1, y1, y2, y3, y4 = [], [], [], [], []
myvar = count(0, 3)

def animate(i):
    x1.append(next(myvar))
    y1.append((l1[i]))
    y2.append((l2[i]))
    y3.append((l3[i]))
    y4.append((l4[i]))

    axes.plot(x1, y1, color="red")
    axes.plot(x1, y2, color="gray")
    axes.plot(x1, y3, color="blue")
    axes.plot(x1, y4, color="green")


# set ani variable to call the
# function recursively
anim = FuncAnimation(fig, animate, interval=30)
输出 :

示例 2:
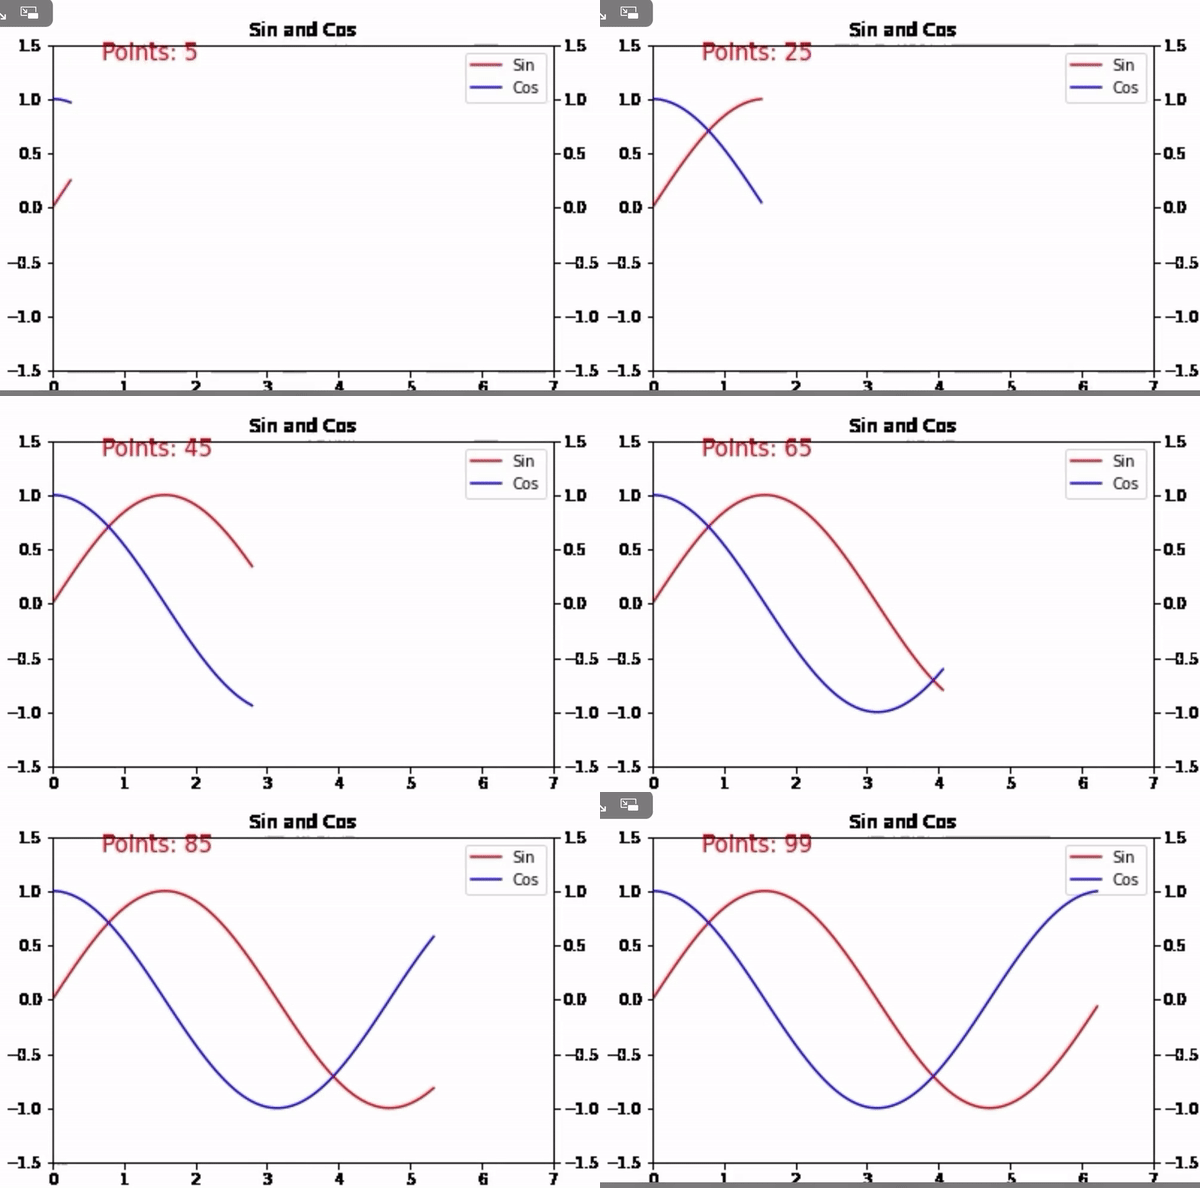
这是在 matplotlib 中为多行设置动画的另一个示例。
- 导入所有必要的库。
蟒蛇3
# import modules
import numpy as np
import matplotlib
import matplotlib.pyplot as plt
import matplotlib.animation as animation
- 创建一个函数更新行以获取每次迭代的新值。
蟒蛇3
def updateline(num, data, line1, data2, line2):
    line1.set_data(data[..., :num])
    line2.set_data(data2[..., :num])

    time_text.set_text("Points: %.0f" % int(num))

    return line1, line2


# generating data of 100 elements
# each for line 1
x = np.linspace(0, 2*np.pi, 100)
y = np.sin(x)
data = np.array([x, y])

# generating data of 100 elements
# each for line 2
x2 = np.linspace(0, 2*np.pi, 100)
y2 = np.cos(x2)
data2 = np.array([x2, y2])

# setup the formating for moving files
Writer = animation.writers['ffmpeg']
Writer = Writer(fps=10, metadata=dict(artist="Me"), bitrate=-1)


fig = plt.figure()
ax = fig.add_subplot(111)
l, = ax.plot([], [], 'r-', label="Sin")
ax2 = ax.twinx()
k = ax2.plot([], [], 'b-', label="Cos")[0]

ax.legend([l, k], [l.get_label(), k.get_label()], loc=0)

ax.set_xlabel("X")

# axis 1
ax.set_ylim(-1.5, 1.5)
ax.set_xlim(0, 7)

# axis 2
ax2.set_ylim(-1.5, 1.5)
ax2.set_xlim(0, 7)

plt.title('Sin and Cos')
time_text = ax.text(0.1, 0.95, "", transform=ax.transAxes,
                    fontsize=15, color='red')
- 保存 mp4 文件 [默认文件保存在当前目录中]。
蟒蛇3
# set line_animation variable to call
# the function recursively
line_animation = animation.FuncAnimation(
    fig, updateline, frames=100, fargs=(data, l, data2, k))

line_animation.save("lines.mp4", writer=Writer)
下面是完整的程序:
蟒蛇3
# import required modules
import numpy as np
import matplotlib
import matplotlib.pyplot as plt
import matplotlib.animation as animation


def updateline(num, data, line1, data2, line2):
    line1.set_data(data[..., :num])
    line2.set_data(data2[..., :num])

    time_text.set_text("Points: %.0f" % int(num))

    return line1, line2


# generating data of 100 elements
# each for line 1
x = np.linspace(0, 2*np.pi, 100)
y = np.sin(x)
data = np.array([x, y])

# generating data of 100 elements
# each for line 2
x2 = np.linspace(0, 2*np.pi, 100)
y2 = np.cos(x2)
data2 = np.array([x2, y2])

# setup the formating for moving files
Writer = animation.writers['ffmpeg']
Writer = Writer(fps=10, metadata=dict(artist="Me"), bitrate=-1)


fig = plt.figure()
ax = fig.add_subplot(111)
l, = ax.plot([], [], 'r-', label="Sin")
ax2 = ax.twinx()
k = ax2.plot([], [], 'b-', label="Cos")[0]

ax.legend([l, k], [l.get_label(), k.get_label()], loc=0)

ax.set_xlabel("X")

# axis 1
ax.set_ylim(-1.5, 1.5)
ax.set_xlim(0, 7)

# axis 2
ax2.set_ylim(-1.5, 1.5)
ax2.set_xlim(0, 7)

plt.title('Sin and Cos')
time_text = ax.text(0.1, 0.95, "", transform=ax.transAxes,
                    fontsize=15, color='red')

# set line_animation variable to call
# the function recursively
line_animation = animation.FuncAnimation(
    fig, updateline, frames=100, fargs=(data, l, data2, k))
line_animation.save("lines.mp4", writer=Writer)
输出 :
