MATLAB 中的条形图
条形图是非连续或离散变量的图解表示。它有垂直和水平两种类型。当高度轴在 y 轴上时,它是一个垂直条形图,当高度轴在 x 轴上时,它是一个水平条形图。
在 MATLAB 中,我们有一个名为bar()的函数,它允许我们绘制条形图。
句法:
bar(X,Y)
where X and Y represent the x and the y axis of the plane. The X and Y both are vectors.
现在让我们来看一些例子。
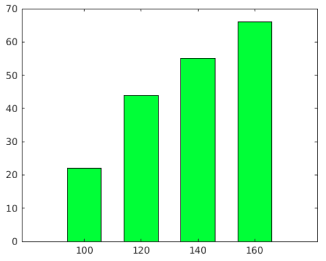
示例 1:一个简单的条形图:
MATLAB
% Coordinates of x-axis
x=100:20:160;
% Coordinates of y-axis
y=[22 44 55 66];

% Bar function to plot the Bar graph
% Set the width of each bar to 60 percent
% of the total space available for each bar
% Set the bar color green
bar(x,y,0.6,"green");
MATLAB
% 3 groups are made with 4 bars
% ";" is used to seperate the groups
y=[2 5 4 1; 5 3 3 1; 2 8 4 6];

% bar function to plot the bar
bar(y);
MATLAB
% 3 groups
y=[2 5 4 1; 5 3 3 1; 2 8 4 6];

% stacked is used to stack the bars
% on each other
bar(y,'stacked');
MATLAB
% bars with negative values
y=[2 5 4 -1; 5 -3 3 1; -2 8 4 6];

% bar function to display bars
bar(y);
MATLAB
% Coordinates of y axis
y=[2 5 4 1];

% barh() function is used to
% display bar horizontally
barh(y);
输出 :
示例 2: 3 组,每组 4 个小节:
MATLAB
% 3 groups are made with 4 bars
% ";" is used to seperate the groups
y=[2 5 4 1; 5 3 3 1; 2 8 4 6];

% bar function to plot the bar
bar(y);
输出 :

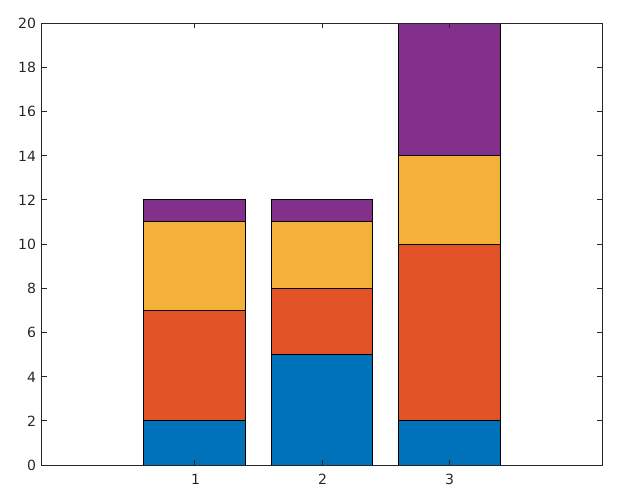
示例 3:显示堆叠条形:
MATLAB
% 3 groups
y=[2 5 4 1; 5 3 3 1; 2 8 4 6];

% stacked is used to stack the bars
% on each other
bar(y,'stacked');
输出 :
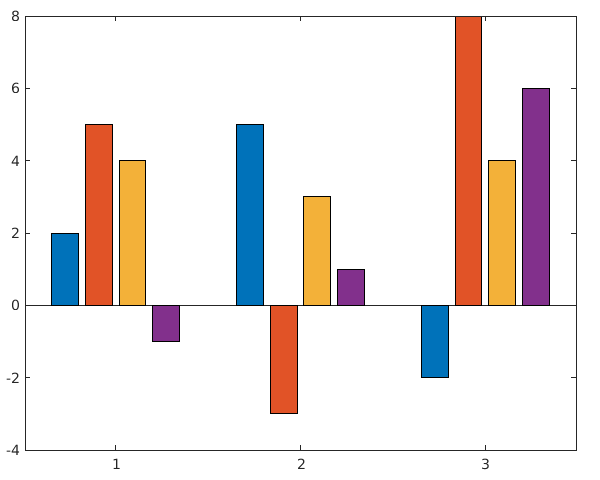
示例 4:显示负柱:
MATLAB
% bars with negative values
y=[2 5 4 -1; 5 -3 3 1; -2 8 4 6];

% bar function to display bars
bar(y);
输出 :
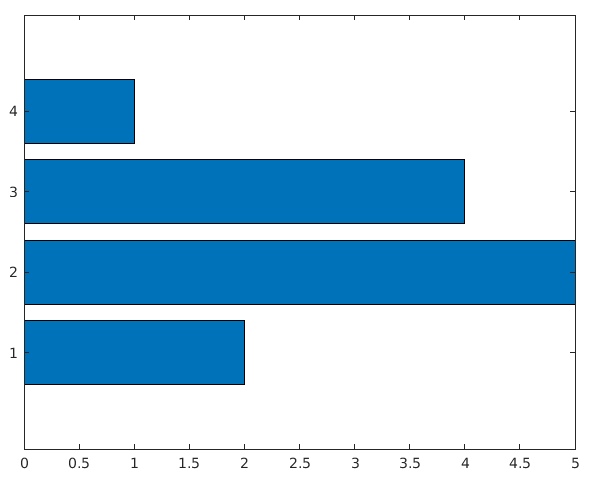
示例 5:显示水平条形图:
MATLAB
% Coordinates of y axis
y=[2 5 4 1];

% barh() function is used to
% display bar horizontally
barh(y);
输出 :