使用 R 中的 ggplot2 更改条形图中条形图的颜色
在本文中,我们将看到在 R 编程语言中使用 ggplot2 更改条形图颜色的各种方法。
为了创建一个简单的条形图,我们将使用函数geom_bar()。
Syntax:
geom_bar(stat, fill, color, width)
Parameters :
- stat : Set the stat parameter to identify the mode.
- fill : Represents color inside the bars.
- color : Represents color of outlines of the bars.
- width : Represents width of the bars.
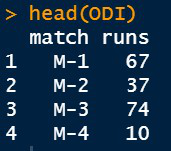
使用中的数据集:
让我们首先绘制一个常规条形图,以显示在没有任何帮助的情况下将打印的常规图。
例子:
R
library(ggplot2)

# Inserting data
ODI <- data.frame(match=c("M-1","M-2","M-3","M-4"),
                   runs=c(67,37,74,10))

# Basic vertical barplot
perf <-ggplot(data=ODI, aes(x=match, y=runs))+
  geom_bar(stat="identity")
perf

# Horizontal bar plot
perf+coord_flip()
R
library(ggplot2)

# Inserting data
ODI <- data.frame(match=c("M-1","M-2","M-3","M-4"),
                   runs=c(67,37,74,10))

# Assigning default and different colors to bar plot
perf <-ggplot(data=ODI, aes(x=match, y=runs,fill=match))+
  geom_bar(stat="identity")
perf
R
library(ggplot2)

# Inserting data
ODI <- data.frame(match=c("M-1","M-2","M-3","M-4"),
                   runs=c(67,37,74,10))

# Assigning default and same colors to bar plot
perf <-ggplot(data=ODI, aes(x=match, y=runs))+
  geom_bar(stat="identity",fill="lightblue")+
  theme_dark()
perf
R
library(ggplot2)

# Inserting data
ODI <- data.frame(match=c("M-1","M-2","M-3","M-4"),
                   runs=c(67,37,74,10))

# Assigning default and same outline colors to bar plot
perf <-ggplot(data=ODI, aes(x=match, y=runs))+
  geom_bar(stat="identity",color="red",fill="white")+
  theme_classic()
perf
R
library(ggplot2)

# Inserting data
ODI <- data.frame(match=c("M-1","M-2","M-3","M-4"),
                   runs=c(67,37,74,10))

# Assigning default and different outline colors to bar plot
perf <-ggplot(data=ODI, aes(x=match, y=runs,color=match))+
  geom_bar(stat="identity",fill="white")+
  theme_classic()
perf
R
library(ggplot2)

# Inserting data
ODI <- data.frame(match=c("M-1","M-2","M-3","M-4"),
                   runs=c(67,37,74,10))

# Assigning colors manually
perf <-ggplot(data=ODI, aes(x=match, y=runs,fill=match))+
  geom_bar(stat="identity")+
  scale_fill_manual(values=c("#9933FF",
                             "#33FFFF",
                             "red",
                             "darkblue"))
perf
R
library(ggplot2)

# Inserting data
ODI <- data.frame(match=c("M-1","M-2","M-3","M-4"),
                   runs=c(67,37,74,10))

# Assigning gray scale colors
perf <-ggplot(data=ODI, aes(x=match, y=runs,fill=match))+
  geom_bar(stat="identity")+
  scale_fill_grey()
perf
输出:

条形图
现在让我们看看颜色是如何添加到条形图中的。
方法一:使用默认颜色
- 不同的填充颜色
使用命令fill在条形内添加颜色。由于条形在不同的 x 轴值中,我们需要将 x 轴变量分配给fill 。在我们的例子中, match在 x 轴上,所以我们写fill=match。您需要在 ggplot2 库下的 aes() 也称为引用函数或美学函数编写此命令。
例子:
电阻
library(ggplot2)

# Inserting data
ODI <- data.frame(match=c("M-1","M-2","M-3","M-4"),
                   runs=c(67,37,74,10))

# Assigning default and different colors to bar plot
perf <-ggplot(data=ODI, aes(x=match, y=runs,fill=match))+
  geom_bar(stat="identity")
perf
输出:

- 相同的填充颜色
使用相同的填充。但是这一次,由于我们必须指定一种颜色,因此我们将在 geom_bar() 中使用它。然后将您选择的颜色分配给填充,如下所示。主题已更改,因为某些颜色图对于 R 中的默认主题可能不可见。
例子:
电阻
library(ggplot2)

# Inserting data
ODI <- data.frame(match=c("M-1","M-2","M-3","M-4"),
                   runs=c(67,37,74,10))

# Assigning default and same colors to bar plot
perf <-ggplot(data=ODI, aes(x=match, y=runs))+
  geom_bar(stat="identity",fill="lightblue")+
  theme_dark()
perf
输出:

- 相同的轮廓
在这里,我们需要的轮廓指定颜色命令的颜色。当填充颜色为白色时,轮廓颜色看起来不错。这是颜色的属性,因为某些颜色会掩盖其他颜色,或者如果我们指定相同的颜色来填充和勾勒两者。由于我们需要相同的填充和相同的轮廓,我们将在 geom_bar() 中编写这些命令。
例子:
电阻
library(ggplot2)

# Inserting data
ODI <- data.frame(match=c("M-1","M-2","M-3","M-4"),
                   runs=c(67,37,74,10))

# Assigning default and same outline colors to bar plot
perf <-ggplot(data=ODI, aes(x=match, y=runs))+
  geom_bar(stat="identity",color="red",fill="white")+
  theme_classic()
perf
输出:

- 不同的轮廓
这里我们需要提供不同的轮廓。填充将是白色的。填充将在 geom_bar() 内。颜色将在 ggplot( ) 下的 aes( ) 内,因为在这种情况下它是可变的。
例子:
电阻
library(ggplot2)

# Inserting data
ODI <- data.frame(match=c("M-1","M-2","M-3","M-4"),
                   runs=c(67,37,74,10))

# Assigning default and different outline colors to bar plot
perf <-ggplot(data=ODI, aes(x=match, y=runs,color=match))+
  geom_bar(stat="identity",fill="white")+
  theme_classic()
perf
输出:

方法二:手动设置颜色
- scale_fill_manual()
此函数用于提供自定义颜色。我们可以将颜色代码写为“#XXXXXX” ,也可以直接将颜色名称写为“color_name” 。填充将在 ggplot2 内,因为我们需要手动为条形分配不同的颜色。调用该函数并手动插入由颜色代码或颜色名称组成的向量。矢量的长度应与条形的数量相同。
例子:
电阻
library(ggplot2)

# Inserting data
ODI <- data.frame(match=c("M-1","M-2","M-3","M-4"),
                   runs=c(67,37,74,10))

# Assigning colors manually
perf <-ggplot(data=ODI, aes(x=match, y=runs,fill=match))+
  geom_bar(stat="identity")+
  scale_fill_manual(values=c("#9933FF",
                             "#33FFFF",
                             "red",
                             "darkblue"))
perf
输出:

同样,我们可以手动设置轮廓颜色。只需在上面的代码中替换关键字fill无处不在即可着色。该函数现在将变为: scale_color_manual( )
- 灰度
这里使用的函数是 scale_fill_grey( )。填充在 aes( ) 内部,因为我们需要不同的灰度颜色。最后调用函数scale_fill_grey()。
例子:
电阻
library(ggplot2)

# Inserting data
ODI <- data.frame(match=c("M-1","M-2","M-3","M-4"),
                   runs=c(67,37,74,10))

# Assigning gray scale colors
perf <-ggplot(data=ODI, aes(x=match, y=runs,fill=match))+
  geom_bar(stat="identity")+
  scale_fill_grey()
perf
输出:
