R – 饼图
饼图是一个圆形的统计图形,它被分成多个切片来说明数字比例。它描绘了一个使用“饼图”的特殊图表,其中每个扇区显示数据的相对大小。圆形图以半径的形式切割成描述相对频率或幅度的段,也称为圆形图。
R – 饼图
R 编程语言使用函数pie()创建饼图。它将正数作为向量输入。
Syntax: pie(x, labels, radius, main, col, clockwise)
Parameters:
- x: This parameter is a vector that contains the numeric values which are used in the pie chart.
- labels: This parameter gives the description to the slices in pie chart.
- radius: This parameter is used to indicate the radius of the circle of the pie chart.(value between -1 and +1).
- main: This parameter is represents title of the pie chart.
- clockwise: This parameter contains the logical value which indicates whether the slices are drawn clockwise or in anti clockwise direction.
- col: This parameter give colors to the pie in the graph.
创建一个简单的饼图
要创建一个简单的饼图:
- 通过使用上述参数,我们可以绘制一个饼图。
- 可以通过给出简单的标签来描述。
例子:
R
# Create data for the graph.
geeks<- c(23, 56, 20, 63)
labels <- c("Mumbai", "Pune", "Chennai", "Bangalore")

# Plot the chart.
pie(geeks, labels)
R
# Create data for the graph.
geeks<- c(23, 56, 20, 63)
labels <- c("Mumbai", "Pune", "Chennai", "Bangalore")

# Plot the chart with title and rainbow
# color pallet.
pie(geeks, labels, main = "City pie chart",
            col = rainbow(length(geeks)))
R
# Create data for the graph.
geeks <- c(23, 56, 20, 63)
labels <- c("Mumbai", "Pune", "Chennai", "Bangalore")

piepercent<- round(100 * geeks / sum(geeks), 1)

# Plot the chart.
pie(geeks, labels = piepercent,
    main = "City pie chart", col = rainbow(length(geeks)))
legend("topright", c("Mumbai", "Pune", "Chennai", "Bangalore"),
                    cex = 0.5, fill = rainbow(length(geeks)))
R
# Get the library.
library(plotrix)

# Create data for the graph.
geeks <- c(23, 56, 20, 63)
labels <- c("Mumbai", "Pune", "Chennai", "Bangalore")

piepercent<- round(100 * geeks / sum(geeks), 1)

# Plot the chart.
pie3D(geeks, labels = piepercent,
    main = "City pie chart", col = rainbow(length(geeks)))
legend("topright", c("Mumbai", "Pune", "Chennai", "Bangalore"),
                    cex = 0.5, fill = rainbow(length(geeks)))
输出:

饼图,包括标题和颜色
创建颜色和标题饼图。
- 通过为图表提供标题并添加标签来获取制作饼图所需的所有参数。
- 我们可以通过向点添加更多具有更多颜色的参数来添加更多特征。
例子:
R
# Create data for the graph.
geeks<- c(23, 56, 20, 63)
labels <- c("Mumbai", "Pune", "Chennai", "Bangalore")

# Plot the chart with title and rainbow
# color pallet.
pie(geeks, labels, main = "City pie chart",
            col = rainbow(length(geeks)))
输出:

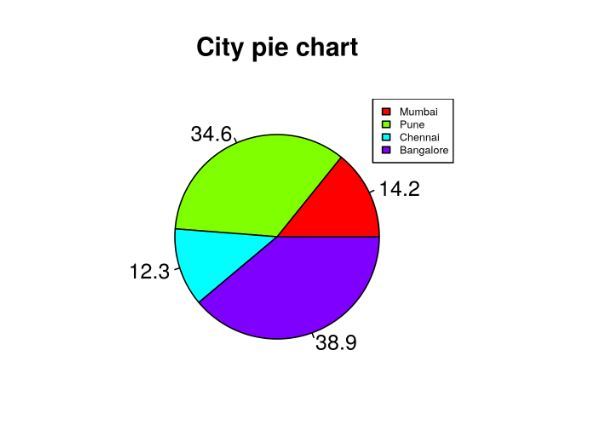
切片百分比和图表图例
要创建图表图例和切片百分比,我们可以通过以下方法进行绘制。
- 饼图还有两个属性:
- 切片百分比
- 图表图例。
- 我们可以以百分比的形式显示图表,也可以添加图例。
例子:
R
# Create data for the graph.
geeks <- c(23, 56, 20, 63)
labels <- c("Mumbai", "Pune", "Chennai", "Bangalore")

piepercent<- round(100 * geeks / sum(geeks), 1)

# Plot the chart.
pie(geeks, labels = piepercent,
    main = "City pie chart", col = rainbow(length(geeks)))
legend("topright", c("Mumbai", "Pune", "Chennai", "Bangalore"),
                    cex = 0.5, fill = rainbow(length(geeks)))
输出:

3D 饼图
在这里,我们将使用 plotrix 包创建一个 3D 饼图,然后我们将使用 pie3D()函数绘制 3D 图。
R
# Get the library.
library(plotrix)

# Create data for the graph.
geeks <- c(23, 56, 20, 63)
labels <- c("Mumbai", "Pune", "Chennai", "Bangalore")

piepercent<- round(100 * geeks / sum(geeks), 1)

# Plot the chart.
pie3D(geeks, labels = piepercent,
    main = "City pie chart", col = rainbow(length(geeks)))
legend("topright", c("Mumbai", "Pune", "Chennai", "Bangalore"),
                    cex = 0.5, fill = rainbow(length(geeks)))
输出:
